绘制直方图

Python 中的统计思维(第 1 部分)

Justin Bois

Teaching Professor at the California Institute of Technology

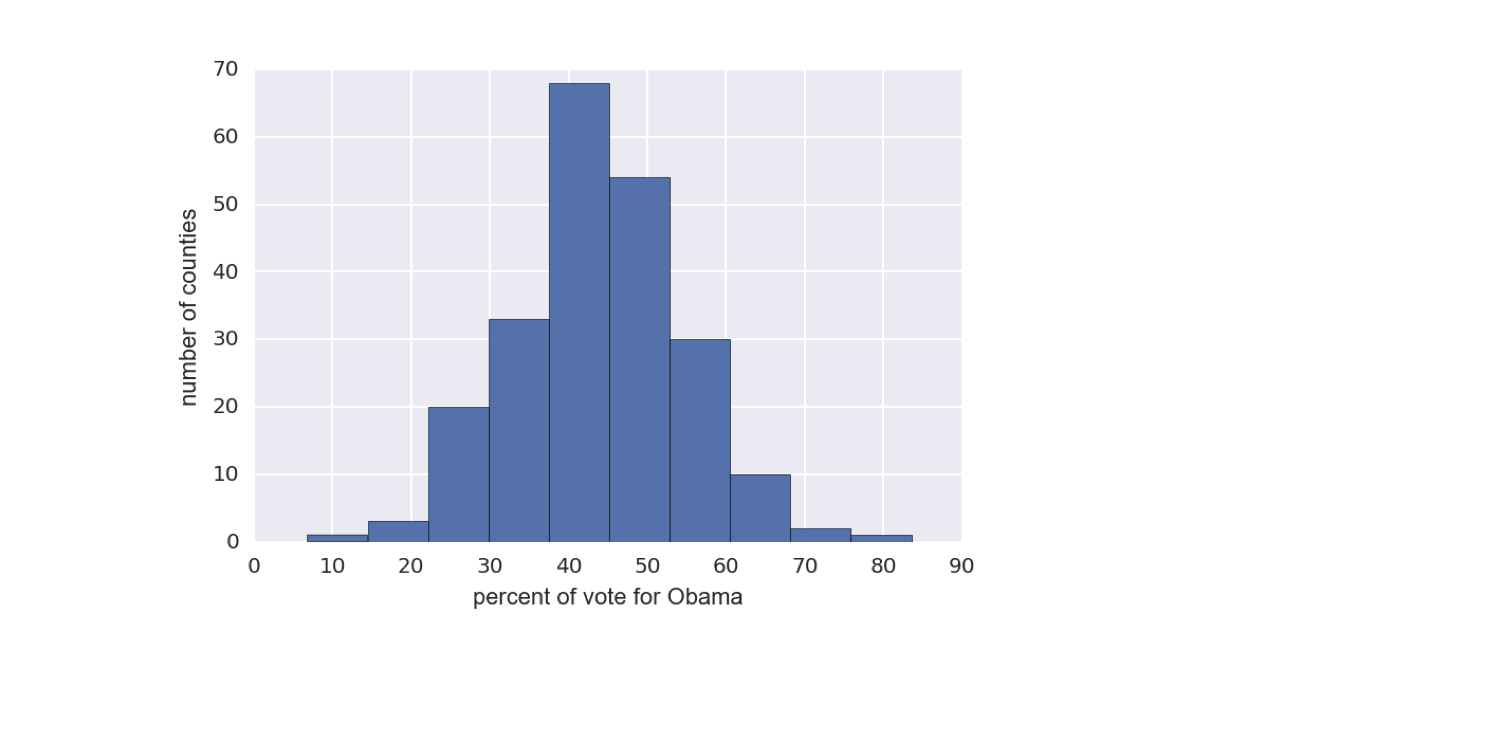
2008 年美国摇摆州选举结果

数据来源:Data.gov (https://www.data.gov/)
ch1-2.003.png

Python 中的统计思维(第 1 部分)

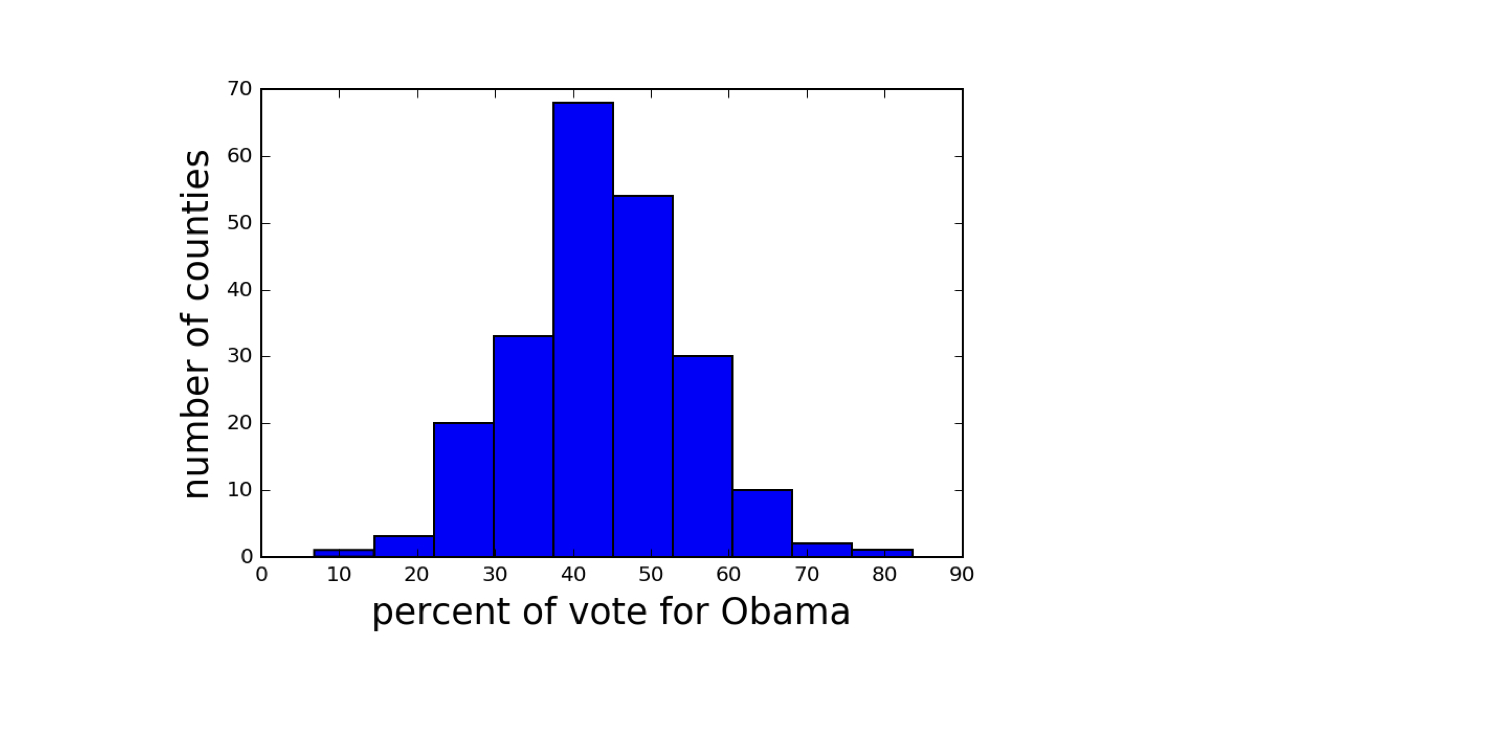
生成直方图

import matplotlib.pyplot as plt
_ = plt.hist(df_swing['dem_share'])
_ = plt.xlabel('奥巴马得票百分比')
_ = plt.ylabel('县数量')
plt.show()
Python 中的统计思维(第 1 部分)

始终标注坐标轴

Python 中的统计思维(第 1 部分)

2008 年美国摇摆州选举结果

数据来源:Data.gov (https://www.data.gov/)
ch1-2.013.png

Python 中的统计思维(第 1 部分)

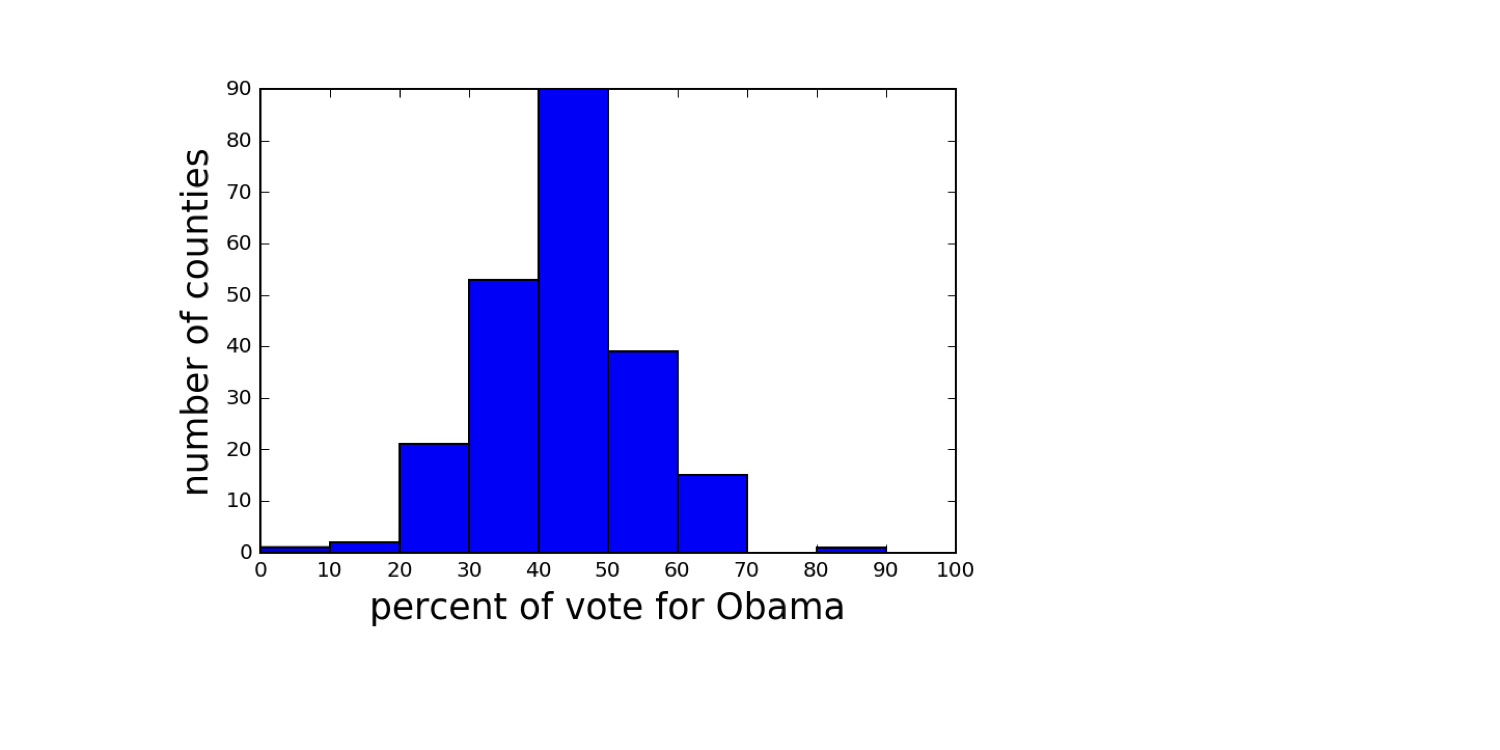
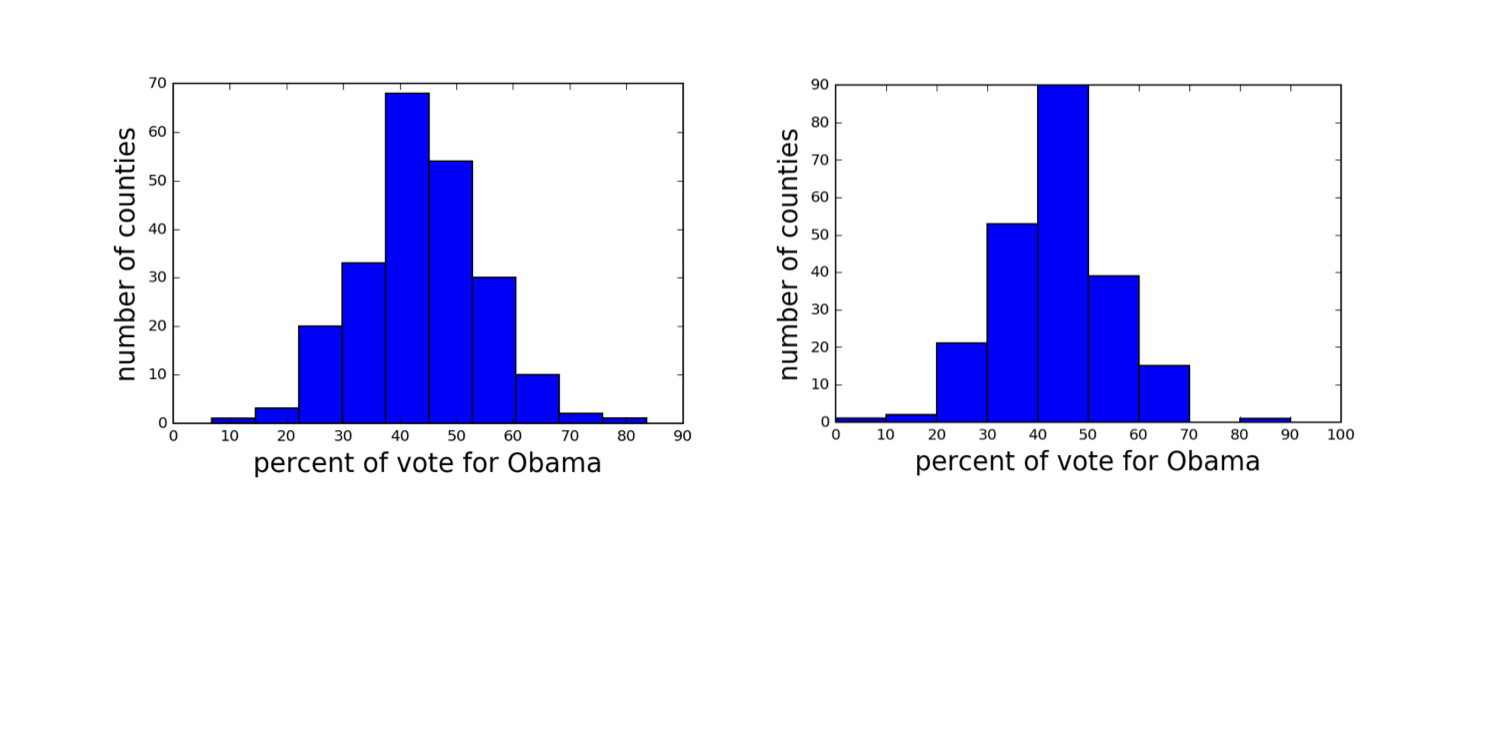
不同分箱的直方图

数据来源:Data.gov (https://www.data.gov/)
ch1-2.015.png

Python 中的统计思维(第 1 部分)

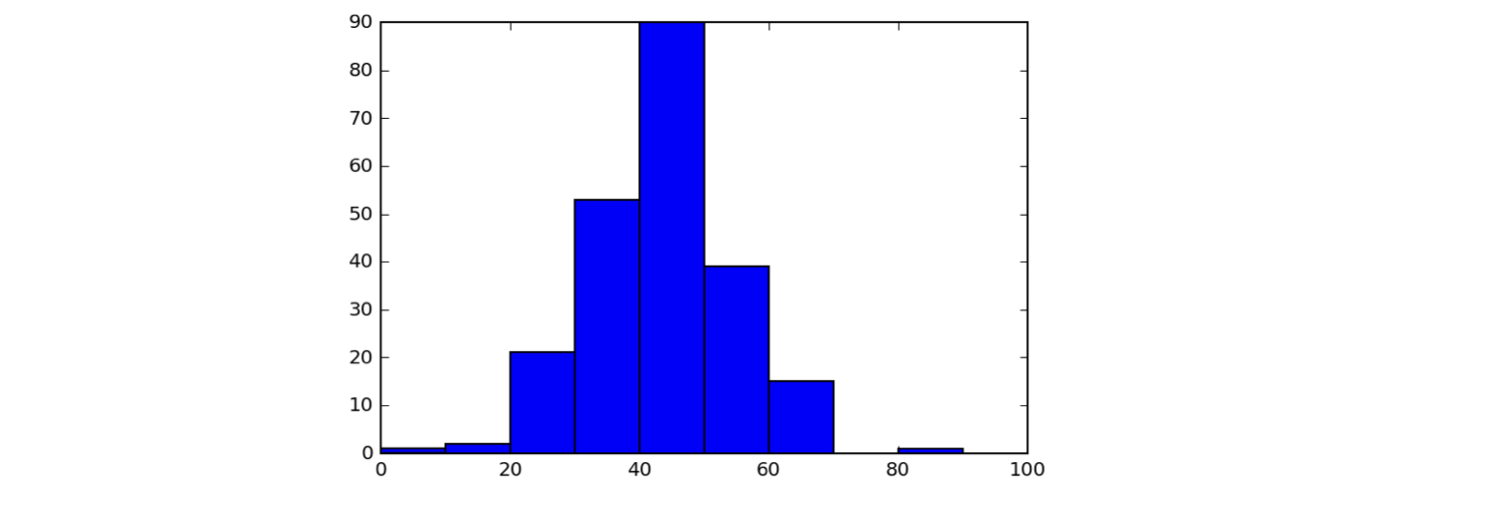
设置直方图的箱数

bin_edges = [0, 10, 20, 30, 40, 50,
                60, 70, 80, 90, 100]
_ = plt.hist(df_swing['dem_share'], bins=bin_edges)
plt.show()
ch1-2.022.png

Python 中的统计思维(第 1 部分)

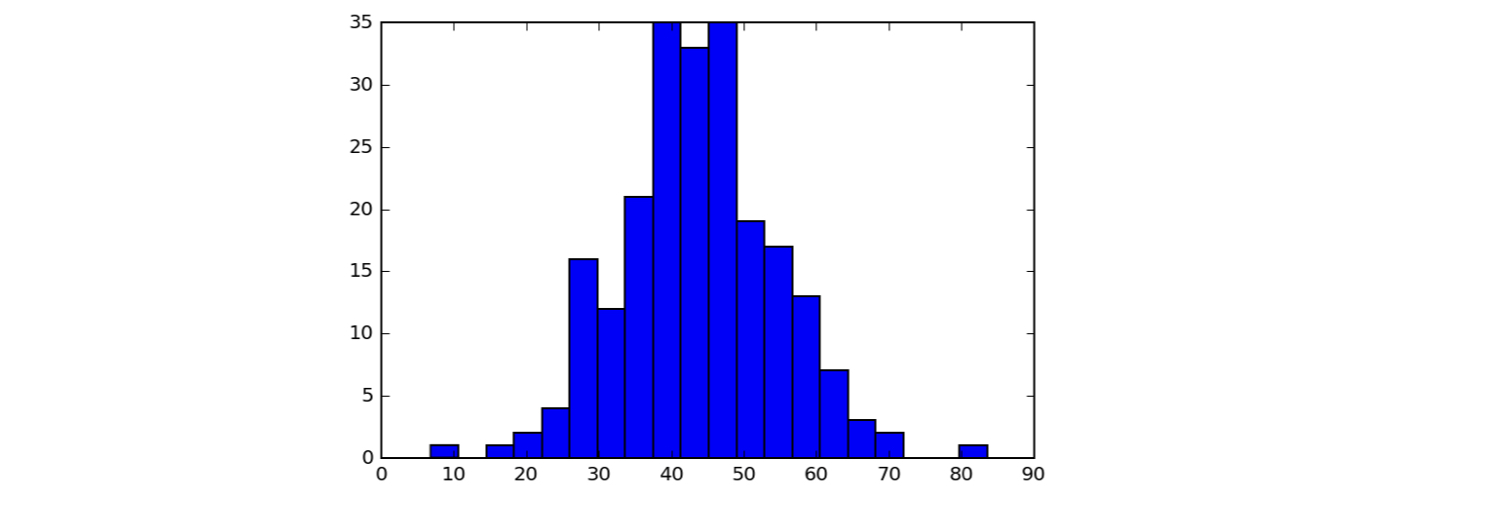
设置直方图的箱数

_ = plt.hist(df_swing['dem_share'], bins=20)
plt.show()
ch1-2.027.png

Python 中的统计思维(第 1 部分)

Seaborn

  • 由 Michael Waskom 编写的优秀基于 Matplotlib 的统计可视化库
Python 中的统计思维(第 1 部分)

设置 Seaborn 样式

import seaborn as sns
sns.set()
_ = plt.hist(df_swing['dem_share'])
_ = plt.xlabel('奥巴马得票百分比')
_ = plt.ylabel('县数量')
plt.show()
Python 中的统计思维(第 1 部分)

Seaborn 样式的直方图

ch1-2.038.png

1 数据来源:Data.gov (https://www.data.gov/)
Python 中的统计思维(第 1 部分)

Passons à la pratique !

Python 中的统计思维(第 1 部分)

Preparing Video For Download...