Python 中的统计思维(第 1 部分)
Justin Bois
Teaching Professor at the California Institute of Technology
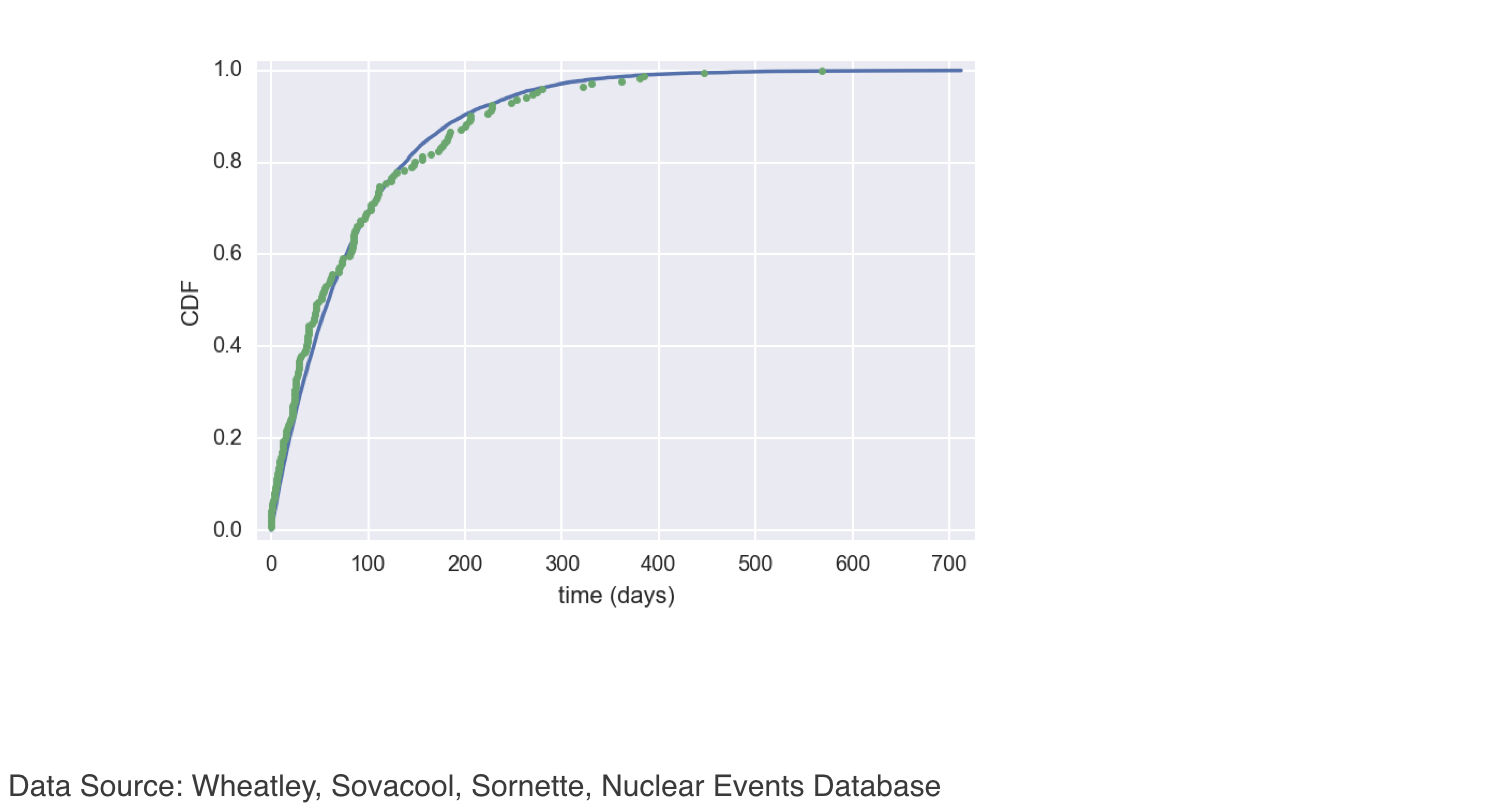
mean = np.mean(inter_times)
samples = rng.exponential(mean, size=10000)
x, y = ecdf(inter_times)
x_theor, y_theor = ecdf(samples)
_ = plt.plot(x_theor, y_theor)
_ = plt.plot(x, y, marker='.', linestyle='none')
_ = plt.xlabel('time (days)')
_ = plt.ylabel('CDF')
plt.show()