面向机器学习的 CI/CD
Ravi Bhadauria
Machine Learning Engineer
outs
stages:
  preprocess:
    ...
  train:
    ...
    outs:
    - metrics.json
    - confusion_matrix.png
metrics
stages:
  preprocess:
    ...
  train:
    ...
    outs:
    - confusion_matrix.png

    metrics:
      - metrics.json:
          cache: false
stages: preprocess: ... train: ... outs: - confusion_matrix.png
metrics: - metrics.json: cache: false
-> dvc metrics show

Path          accuracy    f1_score    precision    recall
metrics.json  0.947       0.8656      0.988        0.7702
-> dvc metrics show
Path accuracy f1_score precision recall metrics.json 0.947 0.8656 0.988 0.7702
修改一个超参数并重新运行 dvc repro
dvc repro
-> dvc metrics diff

Path          Metric     HEAD    workspace    Change
metrics.json  accuracy   0.947   0.9995       0.0525
metrics.json  f1_score   0.8656  0.9989       0.1333
metrics.json  precision  0.988   0.9993       0.0113
metrics.json  recall     0.7702  0.9986       0.2284
-> dvc metrics diff
Path Metric HEAD workspace Change metrics.json accuracy 0.947 0.9995 0.0525 metrics.json f1_score 0.8656 0.9989 0.1333 metrics.json precision 0.988 0.9993 0.0113 metrics.json recall 0.7702 0.9986 0.2284
setup-dvc
steps:
  ...
  - name: Setup DVC
    uses: iterative/setup-dvc@v1

  - name: 运行 DVC 流水线
    run: dvc repro
steps: ... - name: Setup DVC uses: iterative/setup-dvc@v1
- name: 运行 DVC 流水线 run: dvc repro
- name: 写入 CML 报告
  env:
    REPO_TOKEN: ${{ secrets.GITHUB_TOKEN }}
  run: |
    # 打印当前分支的指标
    dvc metrics show --md >> report.md

    # 与 main 分支比较指标
    git fetch --prune
    dvc metrics diff --md main >> report.md

    # 创建 CML 报告
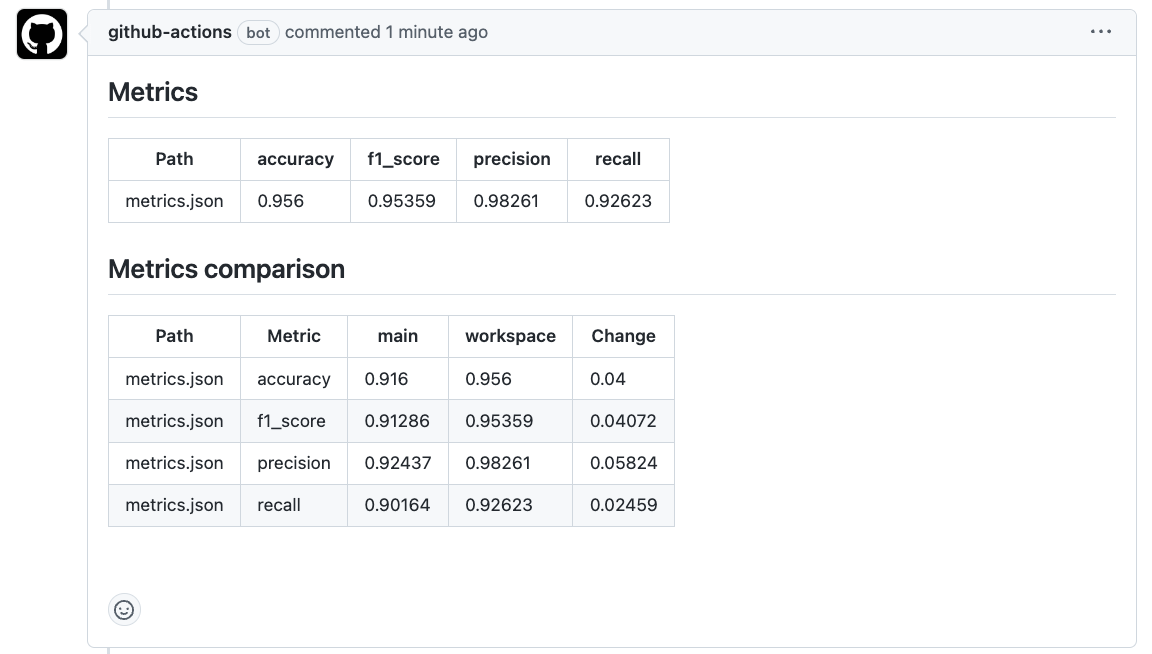
    cml comment create report.md
- name: 写入 CML 报告 env: REPO_TOKEN: ${{ secrets.GITHUB_TOKEN }} run: | # 打印当前分支的指标 dvc metrics show --md >> report.md
# 与 main 分支比较指标 git fetch --prune dvc metrics diff --md main >> report.md
# 创建 CML 报告 cml comment create report.md
scatter
linear
simple
smooth
confusion
confusion_normalized
bar_horizontal
bar_horizontal_sorted
stages:
  train:
    ...
    plots:
    - predictions.csv: # 存放预测的文件名
        template: confusion # 图表样式

        x: predicted_label # CSV 中的 X 轴列名
        y: true_label # CSV 中的 Y 轴列名
        x_label: '预测标签'
        y_label: '真实标签'
        title: 混淆矩阵

        cache: false # 保存在 Git 中
stages: train: ... plots: - predictions.csv: # 存放预测的文件名 template: confusion # 图表样式
x: predicted_label # CSV 中的 X 轴列名 y: true_label # CSV 中的 Y 轴列名 x_label: '预测标签' y_label: '真实标签' title: 混淆矩阵
cache: false # 保存在 Git 中
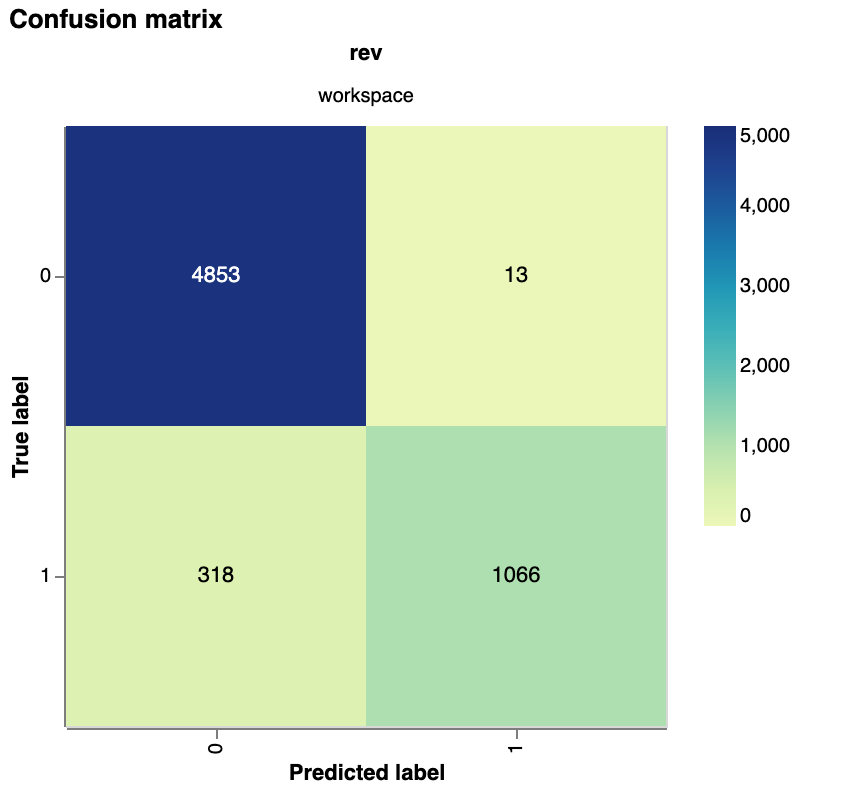
-> dvc plots show predictions.csv
file:///path/to/index.html
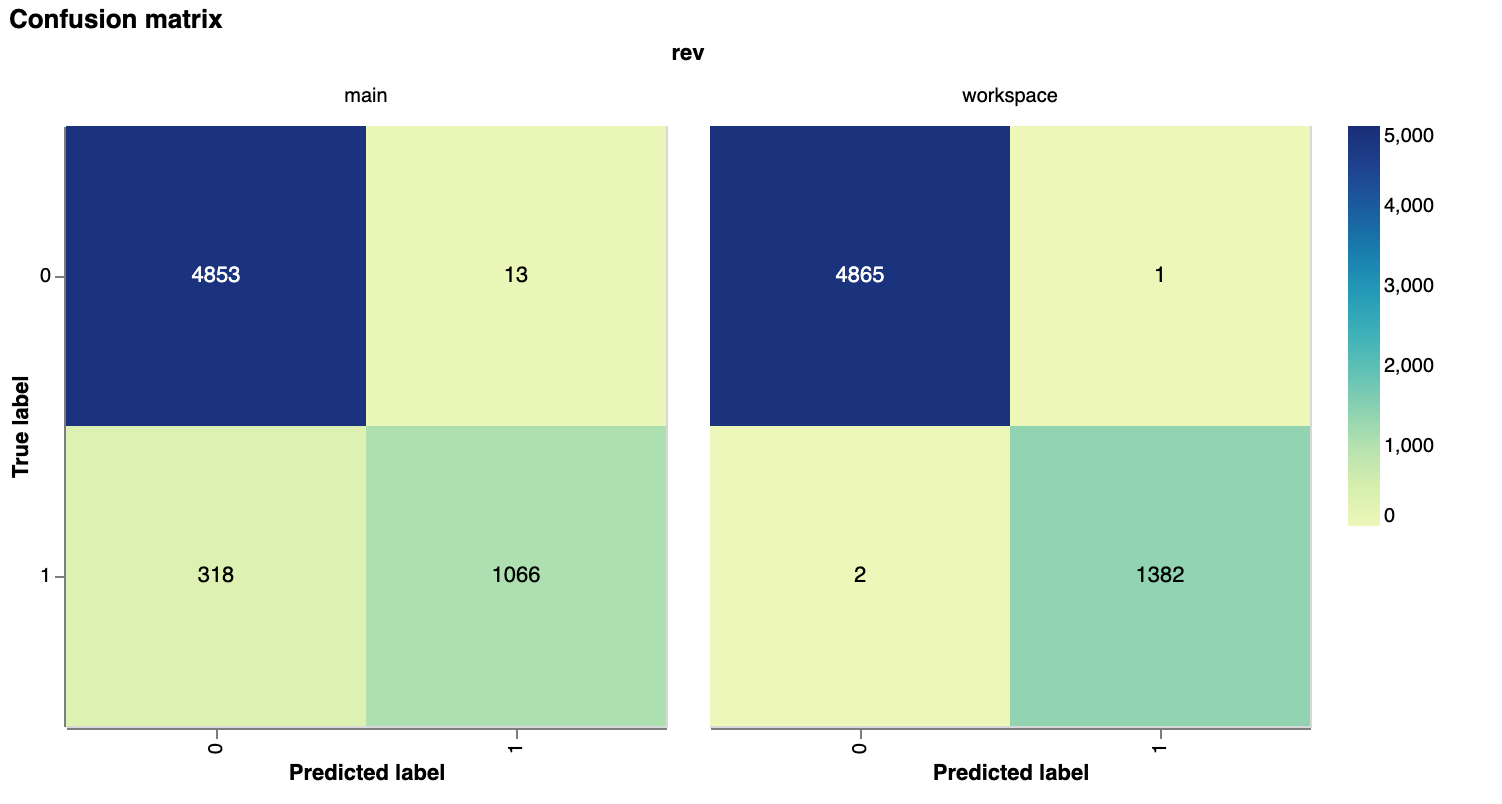
-> dvc plots diff --target predictions.csv main
file:///path/to/index.html
# Python 中的更改
y_proba = model.predict_proba(X_test)
fpr, tpr, _ = roc_curve(y_test,
                        y_proba[:, 1])
# dvc.yaml 中的更改
plots:
- roc_curve.csv:
    template: simple
    x: fpr
    y: tpr
    x_label: '假阳性率'
    y_label: '真阳性率'
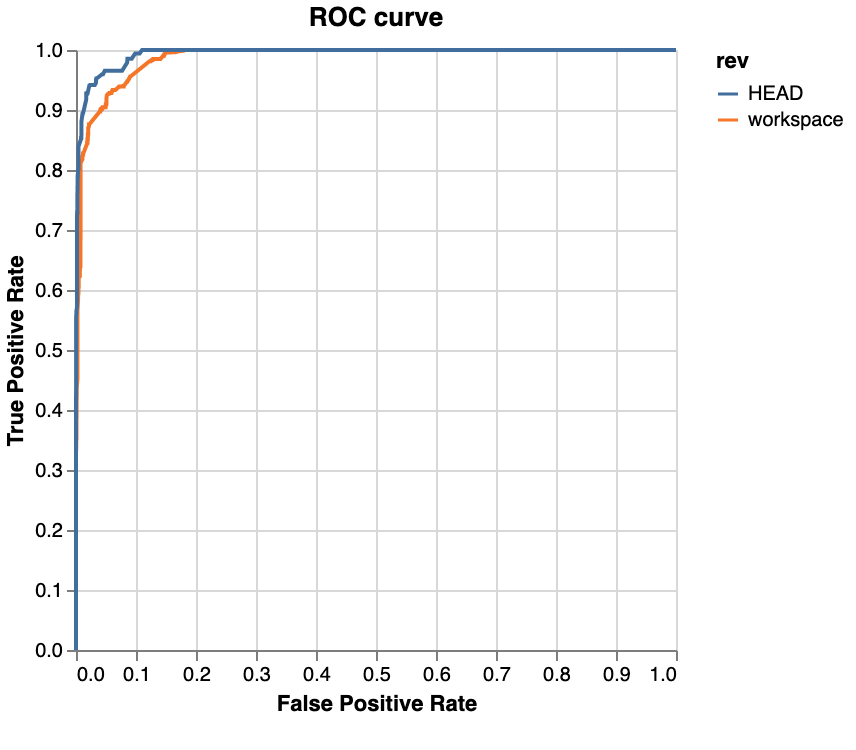
    title: ROC 曲线
    cache: false