假设制定与分布

Python 中的 A/B 测试

Moe Lotfy, PhD

Principal Data Science Manager

定义假设

  • 假设 是:

    • 对事件的解释性陈述
    • 进一步研究的起点
    • 我们想要检验的想法
  • 强有力的假设:

    • 可检验、陈述式、简洁且合乎逻辑
    • 便于系统迭代
    • 更易泛化并验证理解
    • 产出可执行/聚焦的建议
Python 中的 A/B 测试

假设格式

  • 通用表述格式:

    • 基于 X,我们认为若执行 Y
    • 则会发生 Z
    • 以指标 M 度量
  • 备择假设示例:

    • 基于用户体验研究,我们认为若更新结账页设计
    • 购买客户的比例将上升
    • 以购买率衡量
  • 原假设: …购买客户的比例不变…
Python 中的 A/B 测试

计算样本统计量

# Calculate the number of users in groups A and B
n_A = checkout[checkout['checkout_page'] == 'A']['purchased'].count()
n_B = checkout[checkout['checkout_page'] == 'B']['purchased'].count()
print('Group A users:',n_A)
print('Group B users:',n_B)
Group A users: 3000
Group B users: 3000
# Calculate the mean purchase rates of groups A and B
p_A = checkout[checkout['checkout_page'] == 'A']['purchased'].mean()
p_B = checkout[checkout['checkout_page'] == 'B']['purchased'].mean()
print('Group A mean purchase rate:',p_A)
print('Group B mean purchase rate:',p_B)
Group A mean purchase rate: 0.820
Group B mean purchase rate: 0.847
Python 中的 A/B 测试

模拟并绘制分布

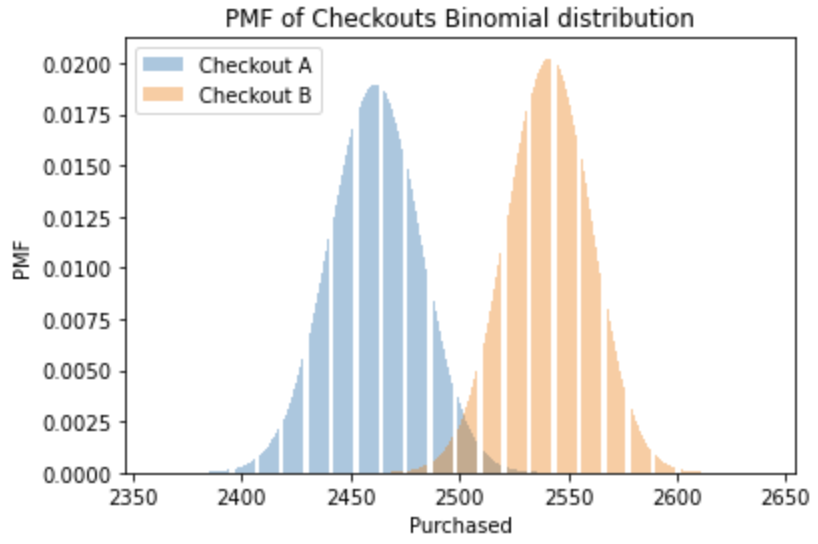
在购买概率为 p 的 n 次试验中,购买人数服从二项分布。

# Import binom from scipy library 
from scipy.stats import binom 
# Create x-axis range and Binomial distributions A and B
x = np.arange(n_A*p_A - 100, n_B*p_B + 100) 
binom_a = binom.pmf(x, n_A, p_A)
binom_b = binom.pmf(x, n_B, p_B) 
# Plot Binomial distributions A and B
plt.bar(x, binom_a, alpha=0.4, label='Checkout A')
plt.bar(x, binom_b, alpha=0.4, label='Checkout B')
plt.xlabel('Purchased')
plt.ylabel('PMF')
plt.title('PMF of Checkouts Binomial distribution')
plt.show()

结账组 A 与 B 的二项分布

Python 中的 A/B 测试

中心极限定理

当样本量足够大时,样本均值 p 的分布将

  • 以总体真实均值为中心近似正态分布
  • 标准差 = 均值的标准误
  • 与原始数据分布无关

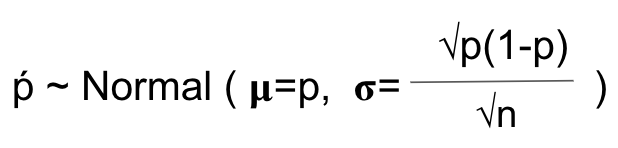
比例的中心极限定理公式

Python 中的 A/B 测试

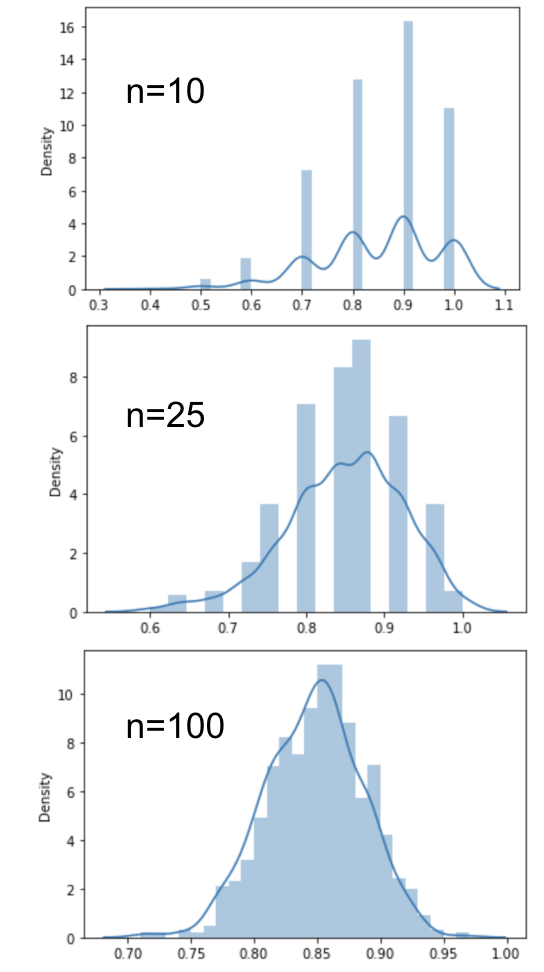
Python 中的中心极限定理

# Set random seed for repeatability 
np.random.seed(47)
# Create an empty list to hold means
sampled_means = []
# Create loop to simulate 1000 sample means
for i in range(1000):
    # Take a sample of n=100
    sample = checkout['purchased'].sample(100,replace=True)
    # Get the sample mean and append to list
    sample_mean = np.mean(sample)
    sampled_means.append(sample_mean)
# Plot distribution
sns.displot(sampled_means, kde=True)
plt.show()

Python 展示中心极限定理:样本量增大时分布趋近正态

Python 中的 A/B 测试

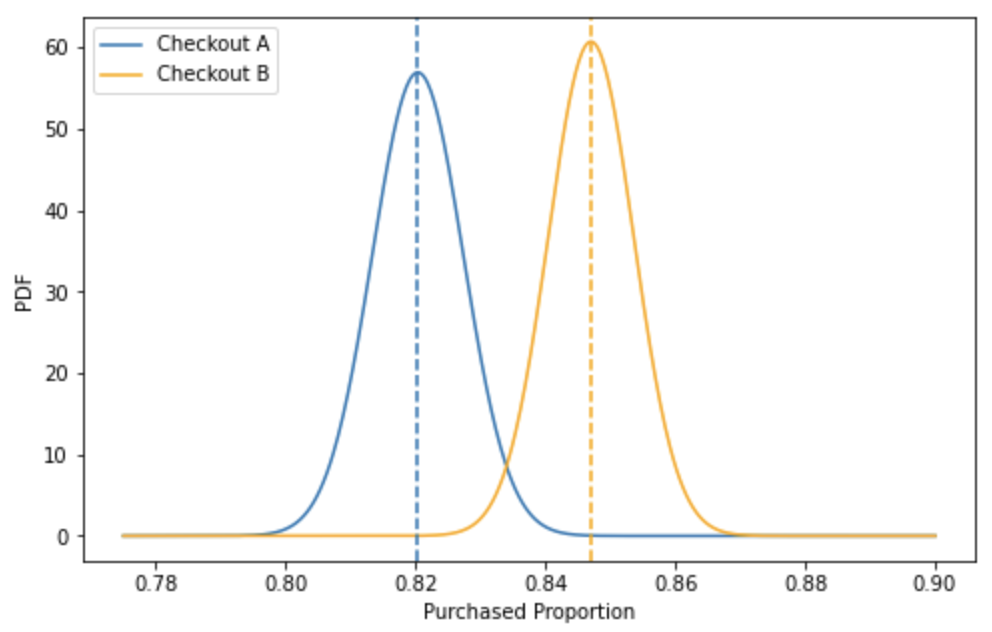
假设的数学表示

# Import norm from scipy library 
from scipy.stats import norm
# Create x-axis range and normal distributions A and B
x = np.linspace(0.775, 0.9, 500)
norm_a = norm.pdf(x, p_A, np.sqrt(p_A*(1-p_A) / n_A))
norm_b = norm.pdf(x, p_B, np.sqrt(p_B*(1-p_B) / n_B))
# Plot normal distributions A and B
sns.lineplot(x=x, y=norm_a, ax=ax, label='Checkout A')
sns.lineplot(x=x, y=norm_b, color='orange', \
             ax=ax, label= 'Checkout B')
ax.axvline(p_A, linestyle='--')
ax.axvline(p_B, linestyle='--')
plt.xlabel('Purchased Proportion')
plt.ylabel('PDF')
plt.legend(loc="upper left")
plt.show()

原假设与备择假设的均值差异图

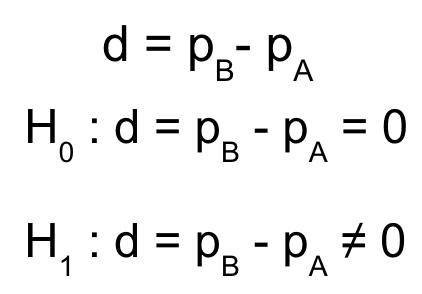
原假设与备择假设的数学表述

Python 中的 A/B 测试

Passons à la pratique !

Python 中的 A/B 测试

Preparing Video For Download...