在 R 中处理缺失数据
Nicholas Tierney
Statistician
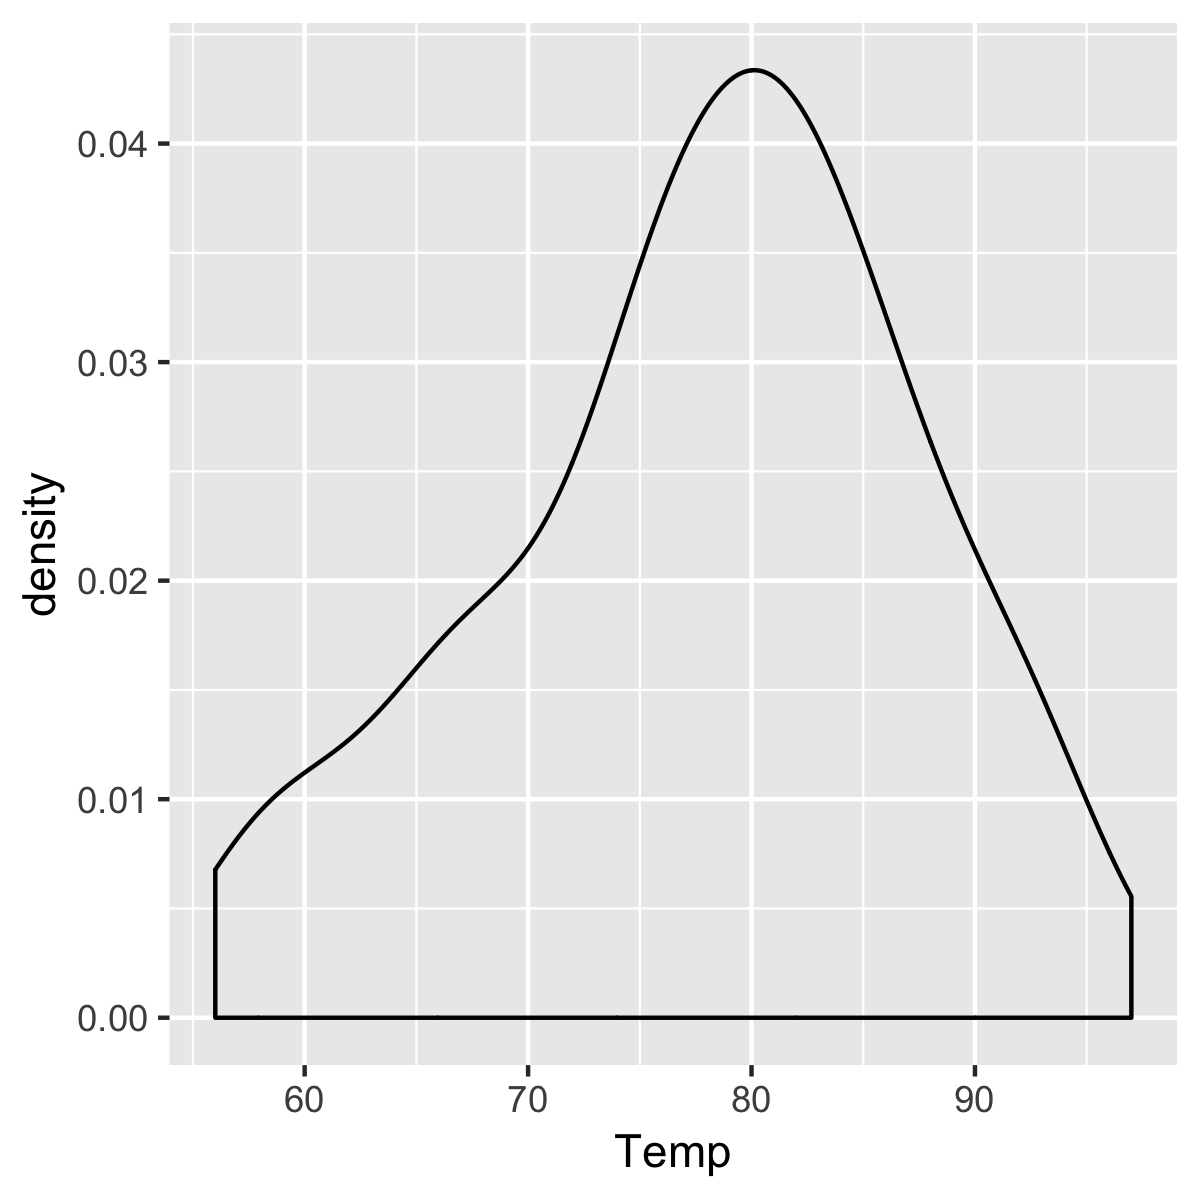
ggplot(airquality,
       aes(x = Temp)) +
  geom_density()
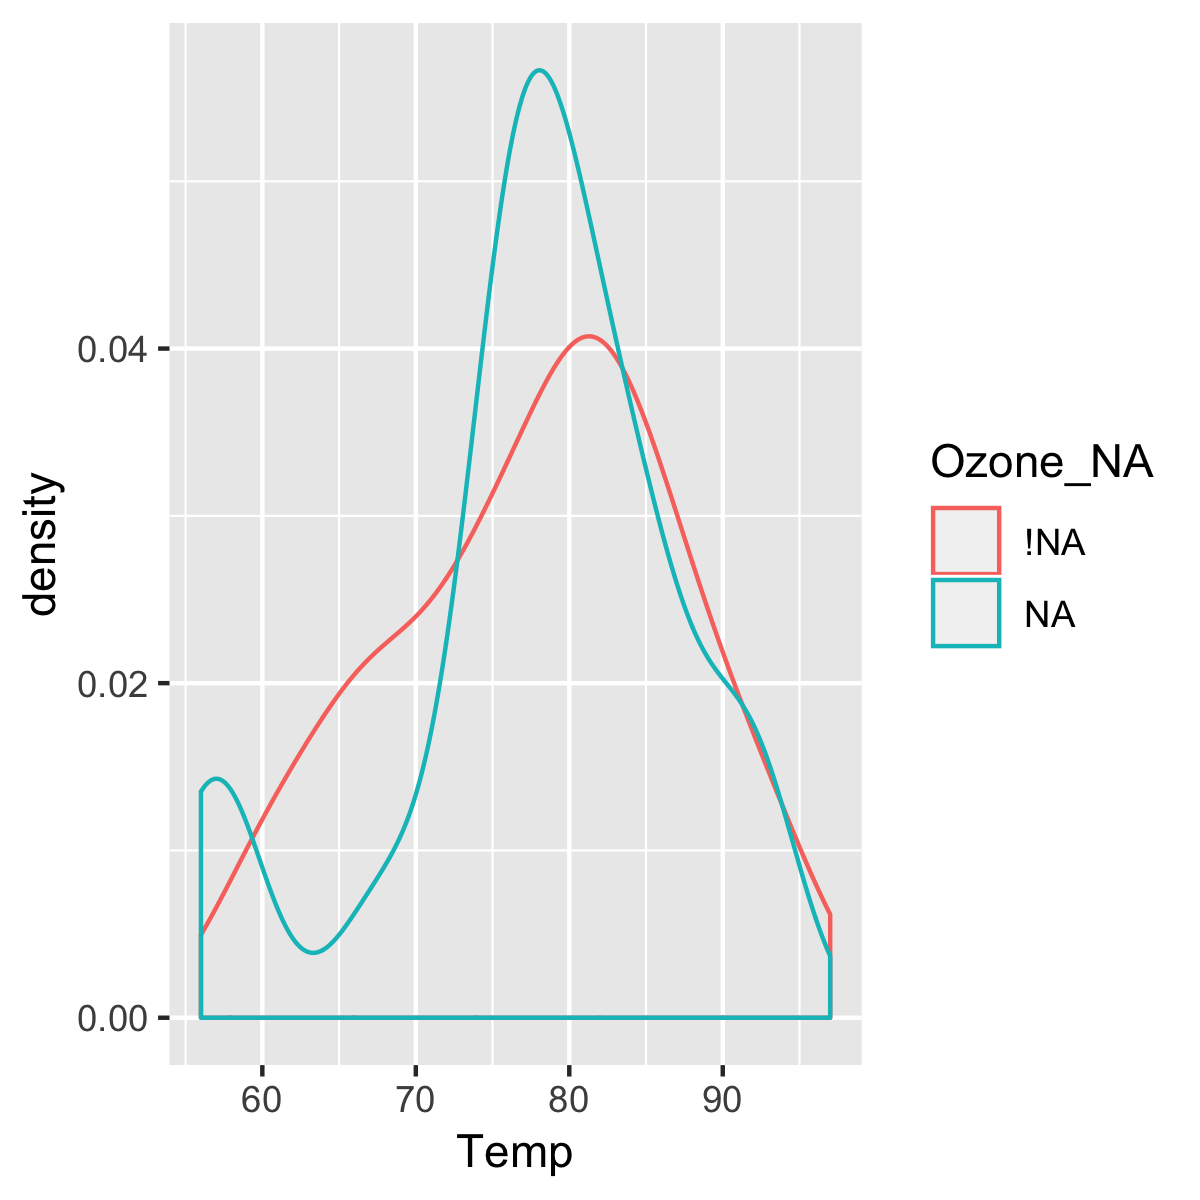
airquality %>%
  bind_shadow() %>%
  ggplot(aes(x = Temp,
             color = Ozone_NA)) +
  geom_density()
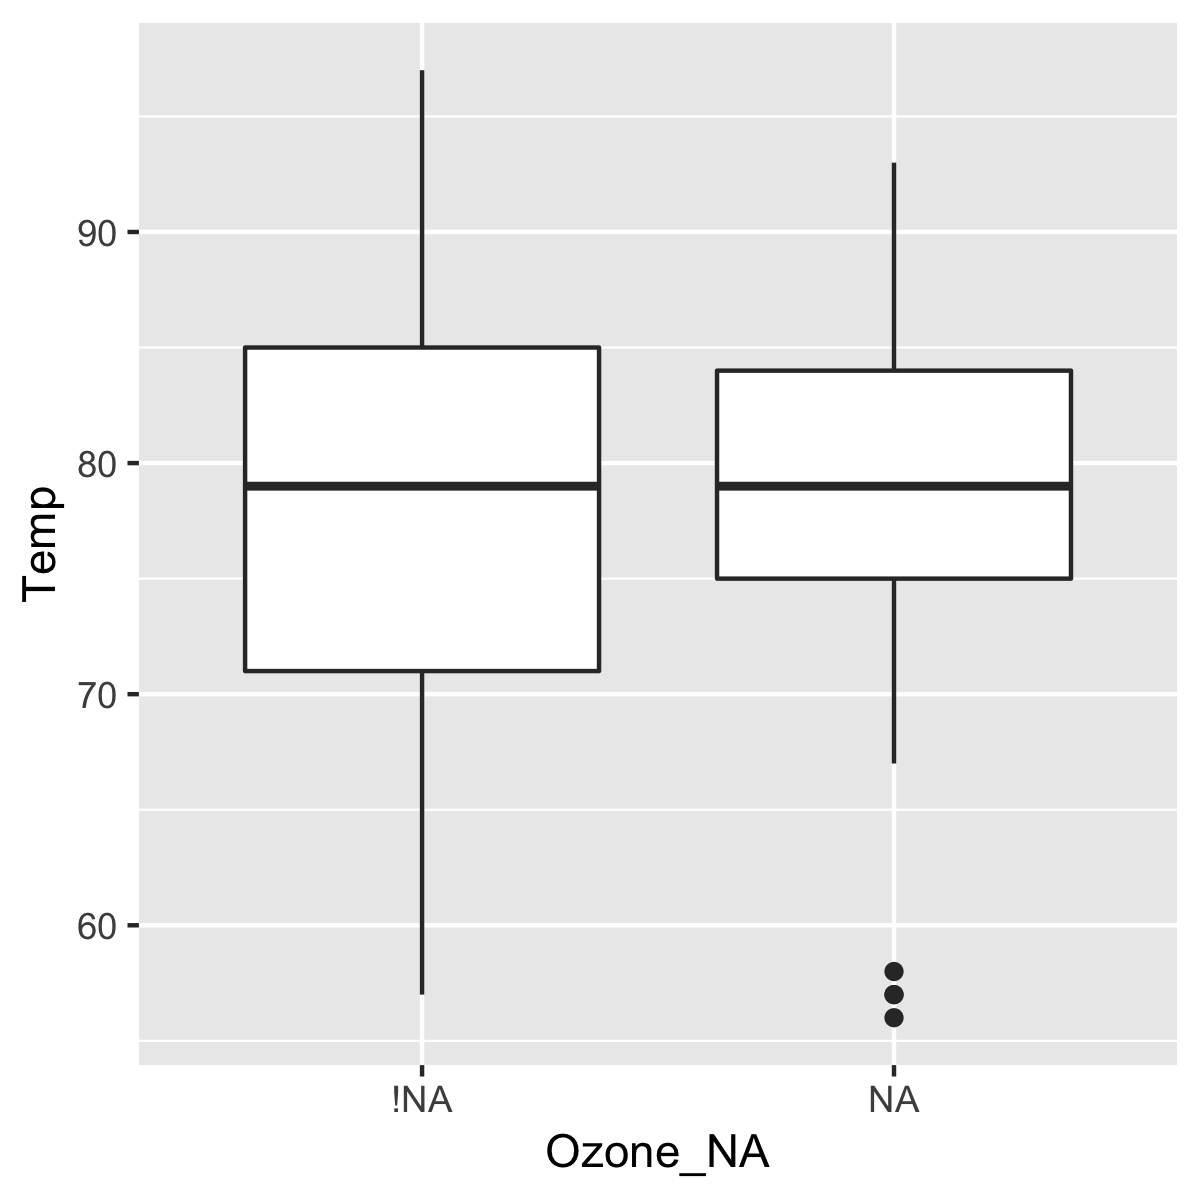
airquality %>%
  bind_shadow() %>%
  ggplot(aes(x = Ozone_NA,
             y = Temp)) +
  geom_boxplot()
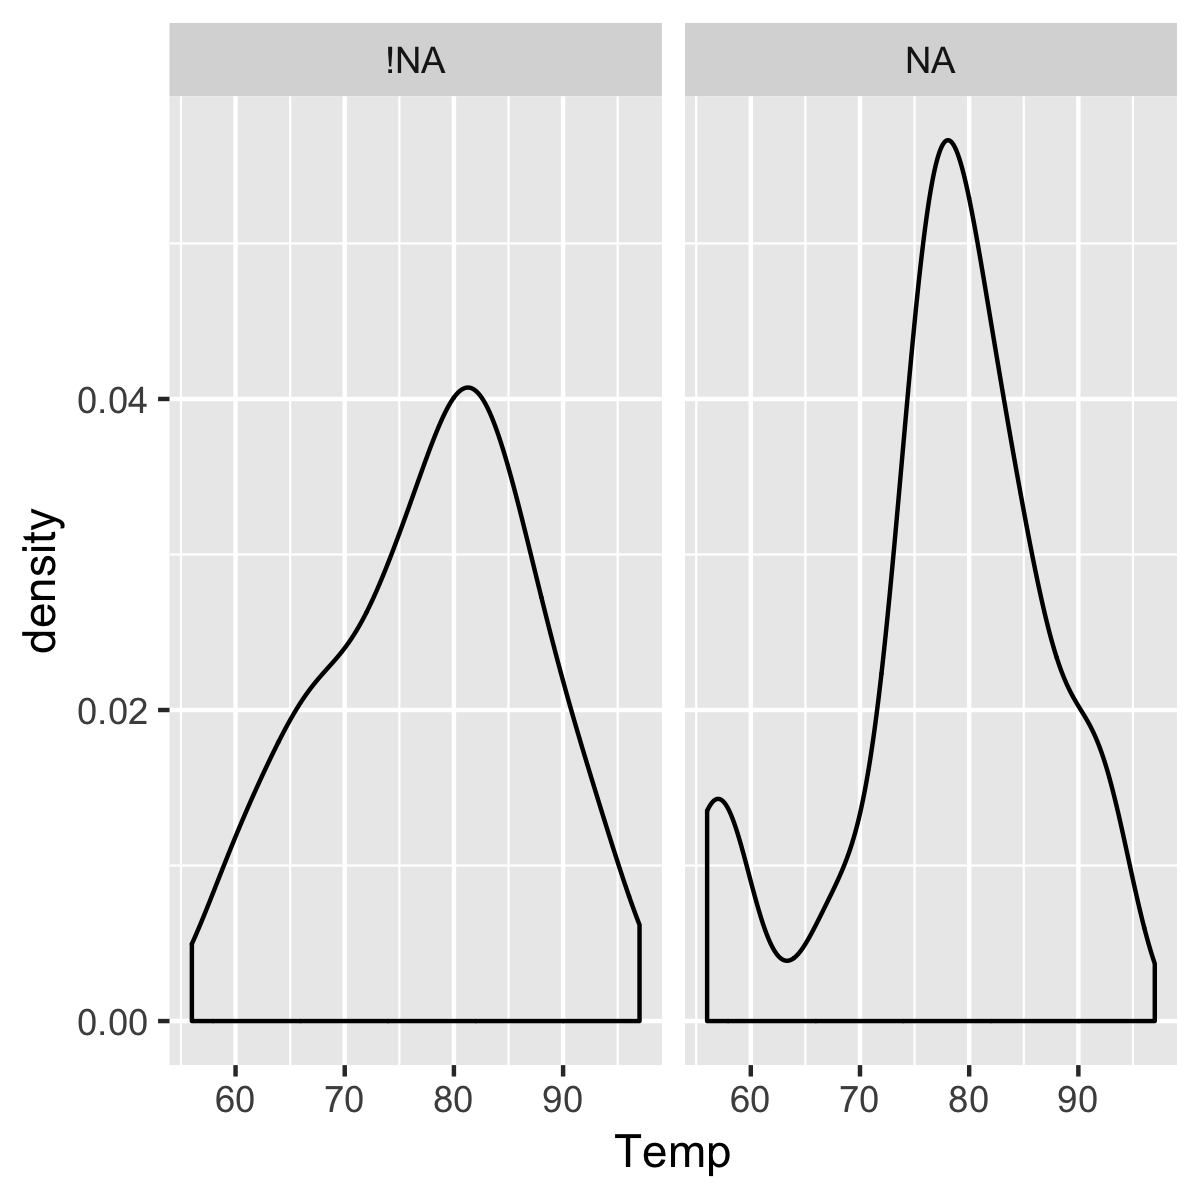
airquality %>%
  bind_shadow() %>%
  ggplot(aes(x = Temp)) +
  geom_density() +
  facet_wrap(~Ozone_NA)
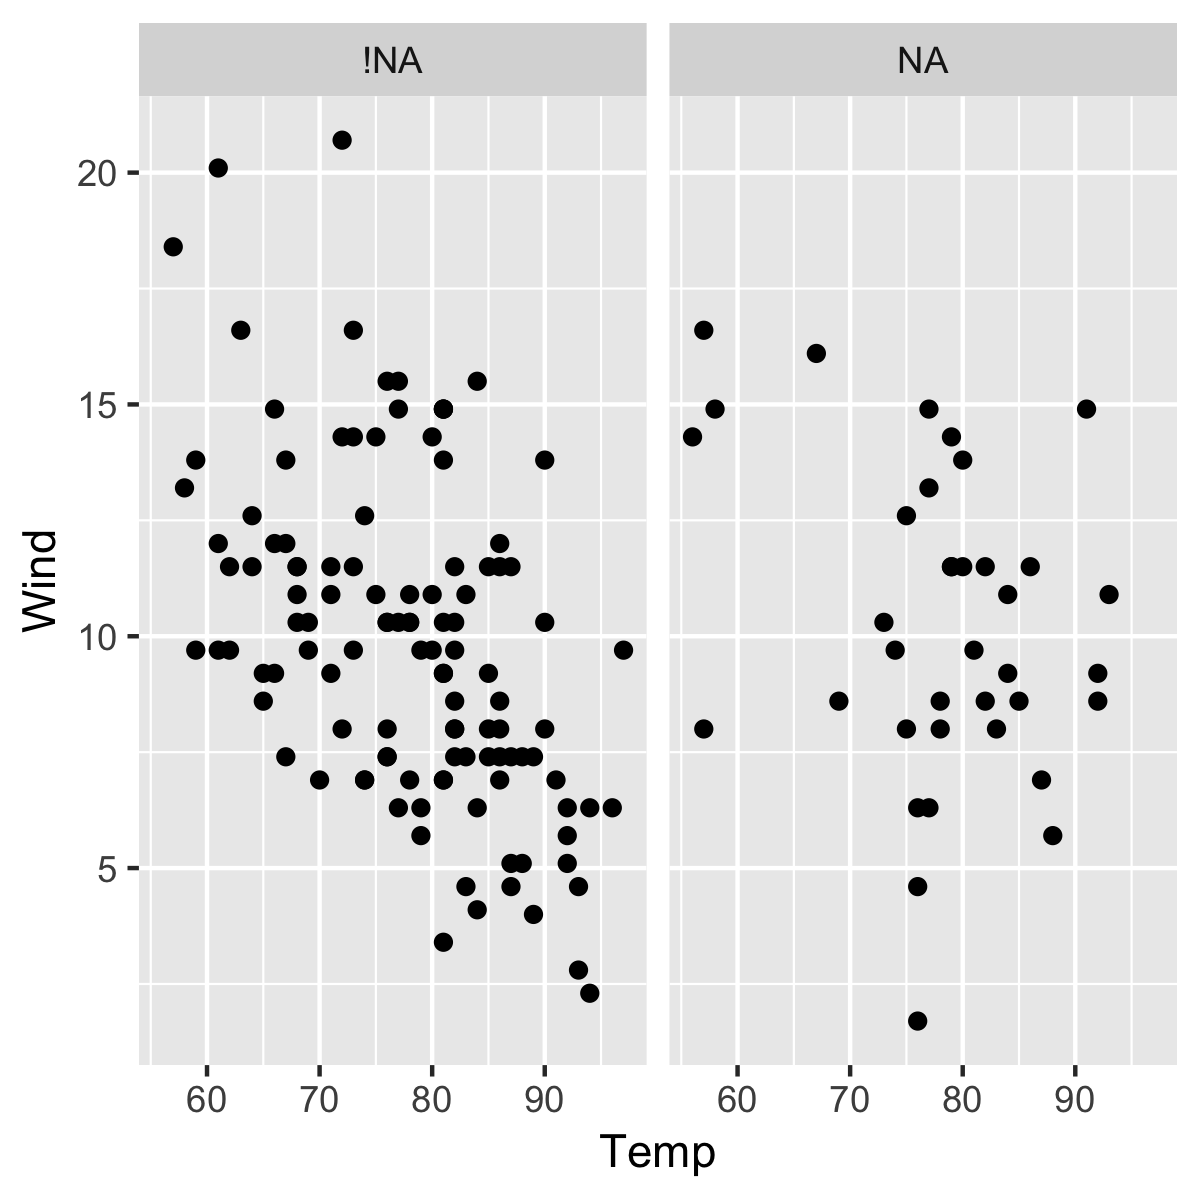
airquality %>%
  bind_shadow() %>%
  ggplot(aes(x = Temp,
             y = Wind)) +
  geom_point() +
  facet_wrap(~ Ozone_NA)
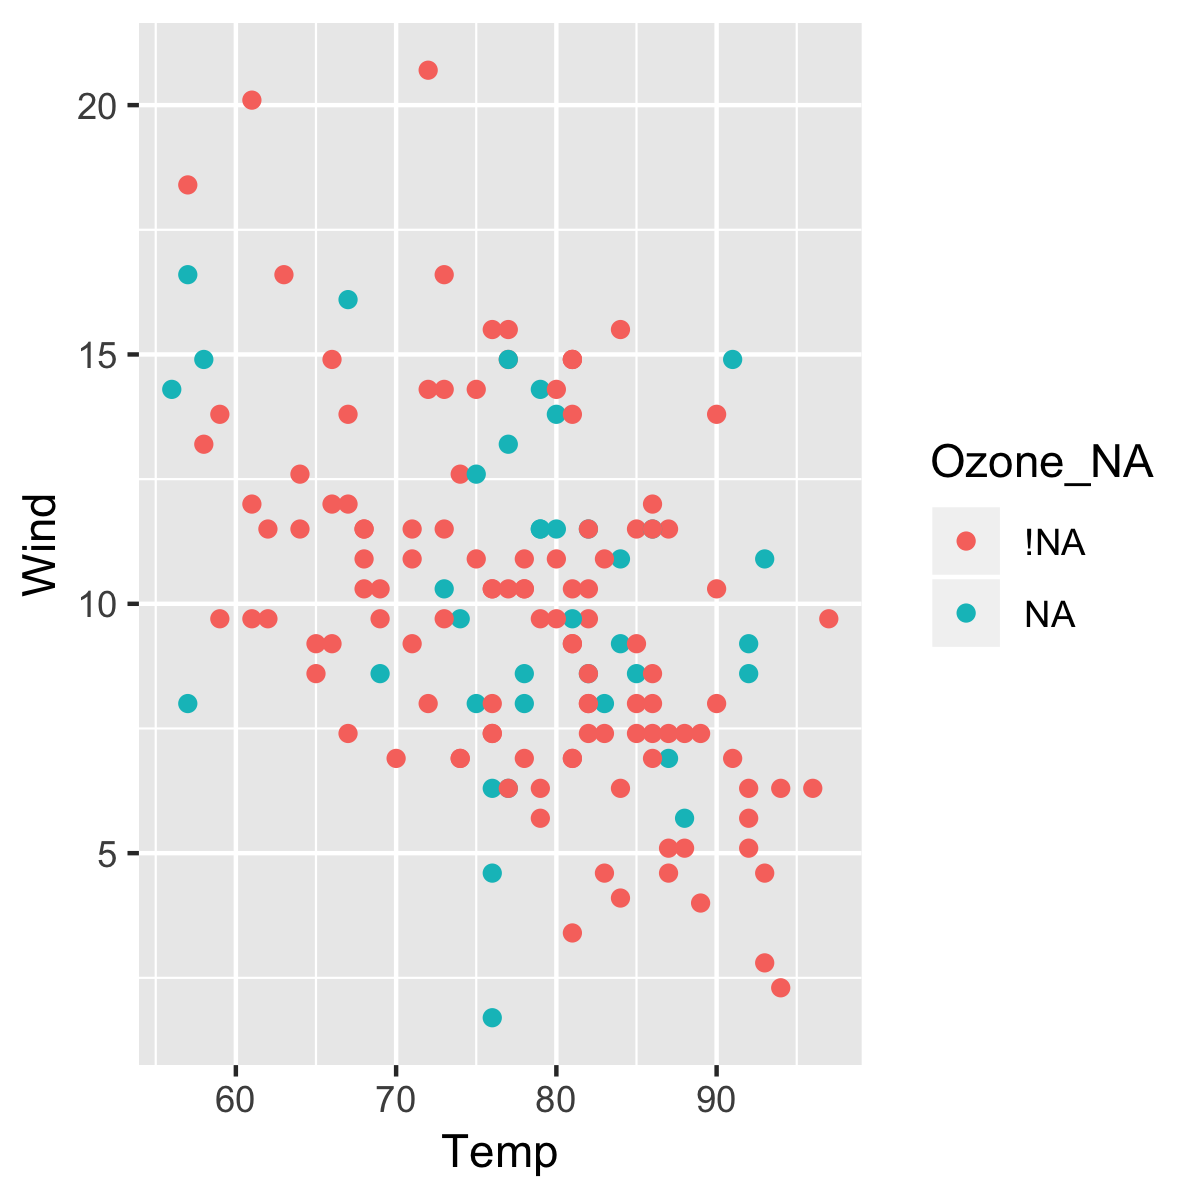
airquality %>%
  bind_shadow() %>%
  ggplot(aes(x = Temp,
             y = Wind,
             color = Ozone_NA)) +
  geom_point()
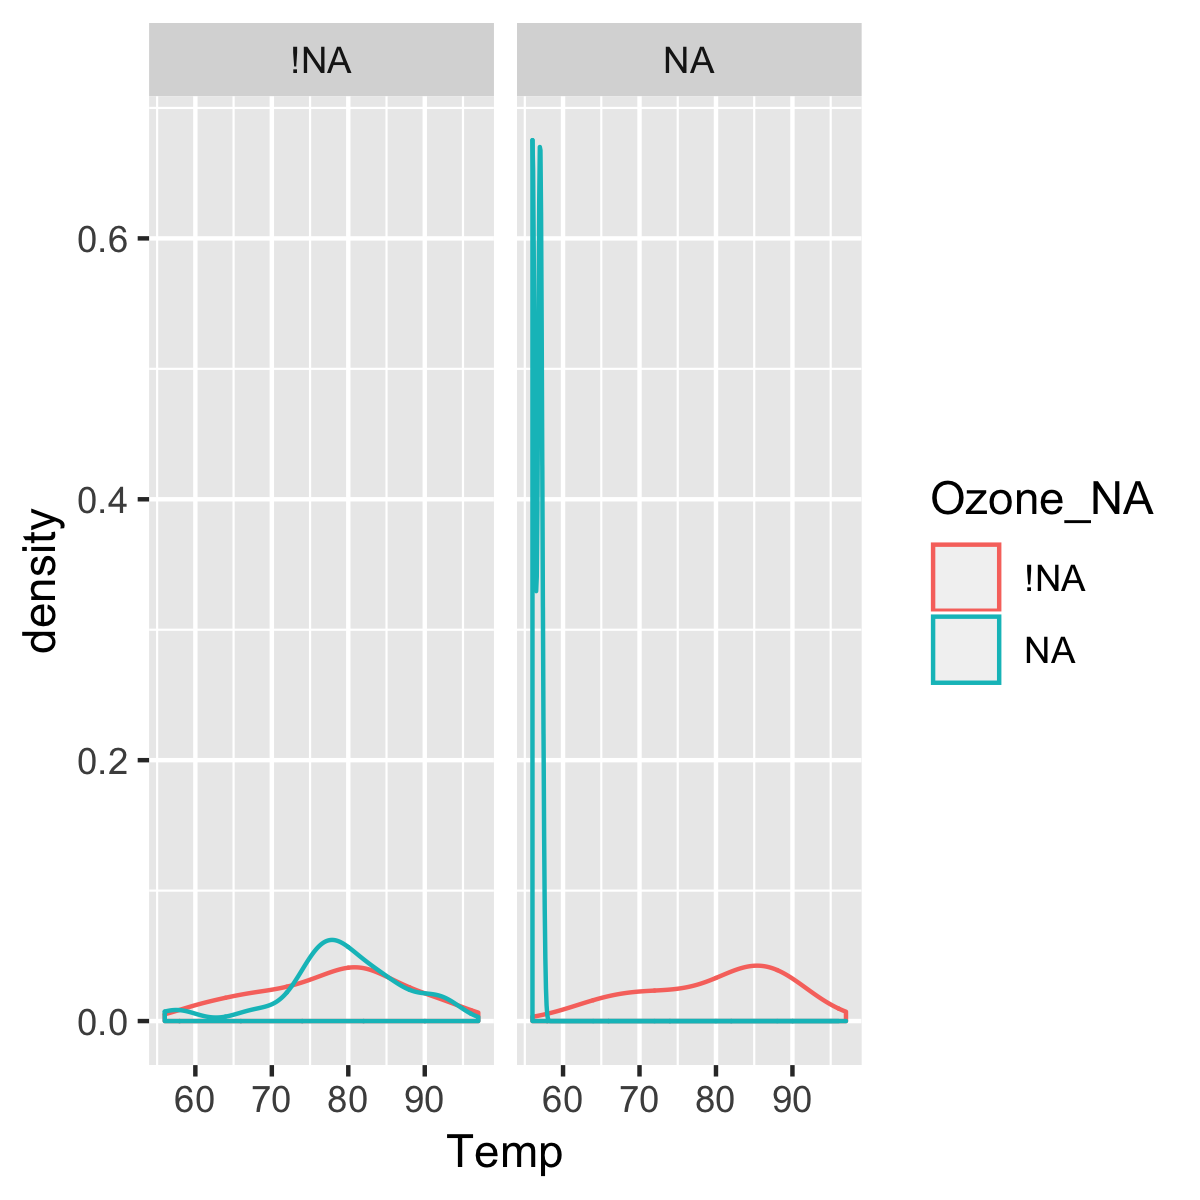
airquality %>%
  bind_shadow() %>%
  ggplot(aes(x = Temp,
             color = Ozone_NA)) +
  geom_density()  +
  facet_wrap(~ Solar.R_NA)