在 Python 中可视化地理空间数据
Mary van Valkenburg
Data Science Program Manager, Nashville Software School
# Construct a map object for Nashville
nashville = [36.1636,-86.7823]
m = folium.Map(location=nashville, zoom_start=10)
# Create a choropleth using the folium Choropleth class
folium.Choropleth(...)
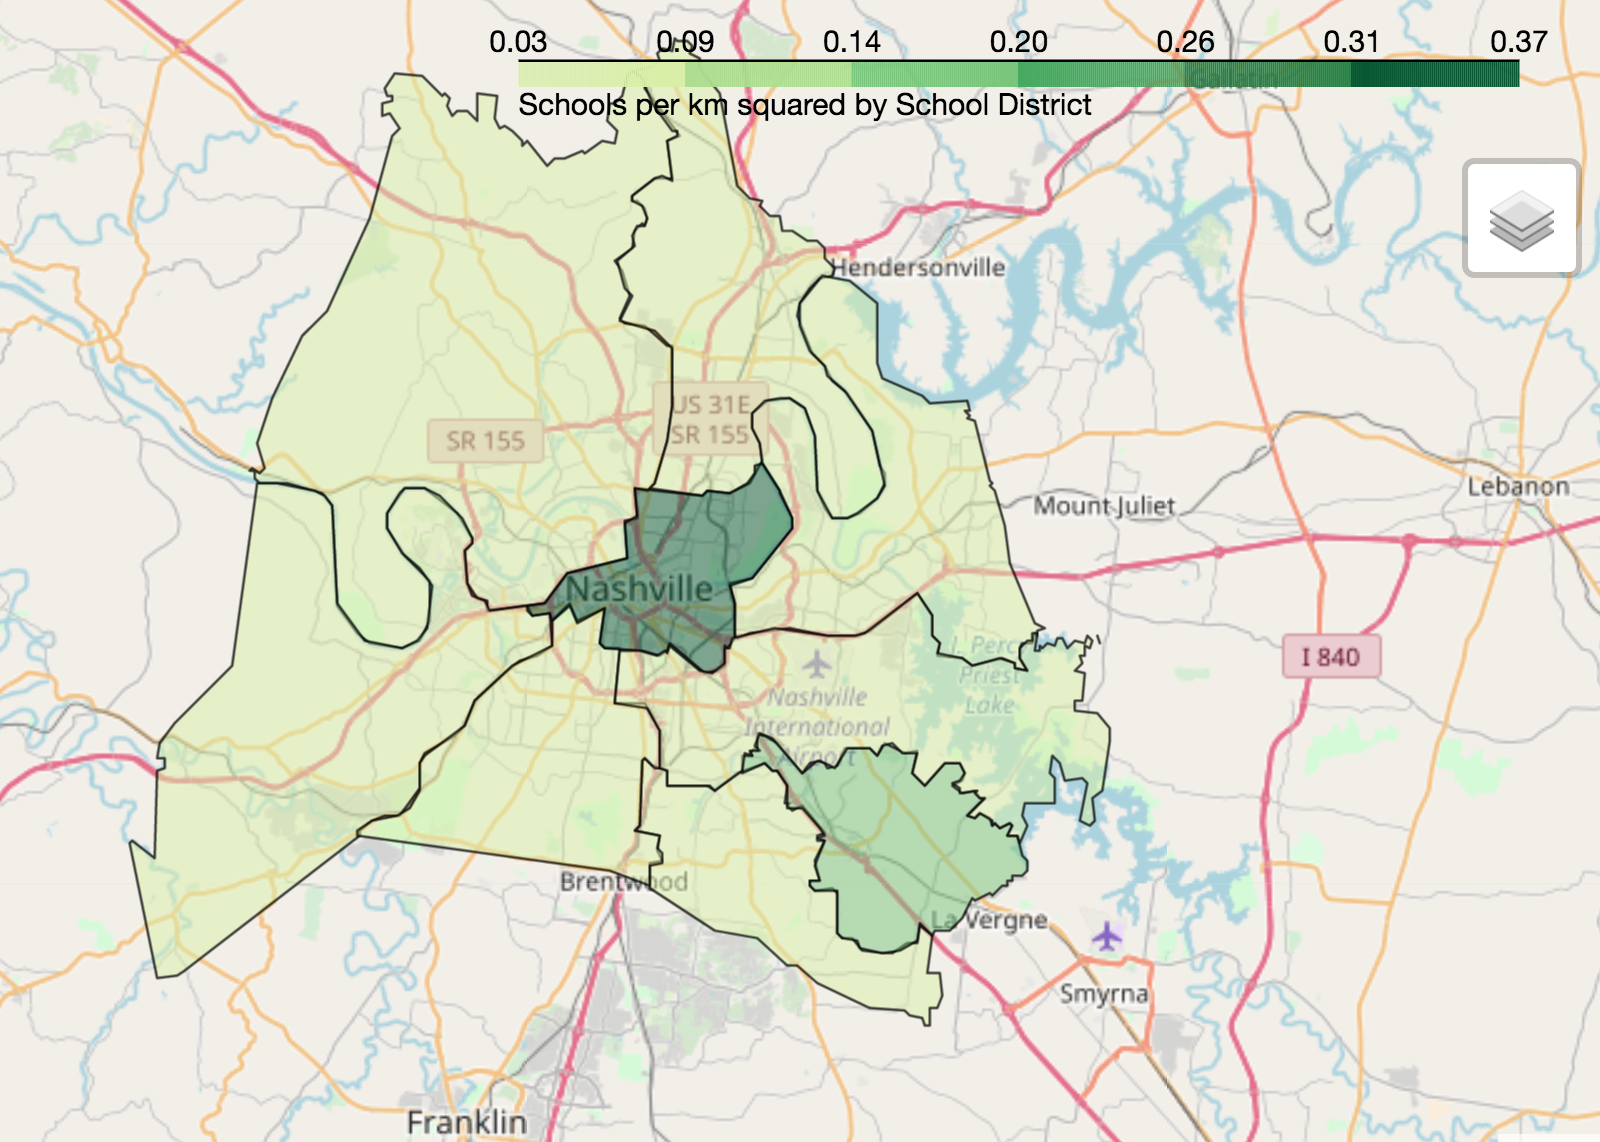
geo_data - 多边形源数据(geojson 文件或 GeoDataFrame)name - 多边形的几何列名(或 geojson 属性)data- 归一化数据的 DataFrame 或 Series 来源columns- 列表:一列对应多边形,另一列为要绘制的值key_on - 绑定数据的 GeoJSON 变量(始终以 feature 开头)fill_color - 多边形填充色(默认蓝色) fill_opacity - 0(透明)到 1(不透明)line_color - 多边形边界线颜色(默认黑色)line_opacity - 0(透明)到 1(不透明) legend_name - 图例标题# Center point and map for Nashville
nashville = [36.1636,-86.7823]
m = folium.Map(location=nashville, zoom_start=10)
# Define a choropleth layer for the map
folium.Choropleth(
geo_data=districts_with_counts,
name='geometry',
data=districts_with_counts,
columns=['district', 'school_density'],
key_on='feature.properties.district',
fill_color='YlGn',
fill_opacity=0.75,
line_opacity=0.5,
legend_name='Schools per km squared by School District'
).add_to(m)
folium.LayerControl().add_to_map()
display(m)

在 Python 中可视化地理空间数据