正态分布

Python 概率基础

Alexander A. Ramírez M.

CEO @ Synergy Vision

测量数据的建模

可能的正态建模指标

Python 概率基础

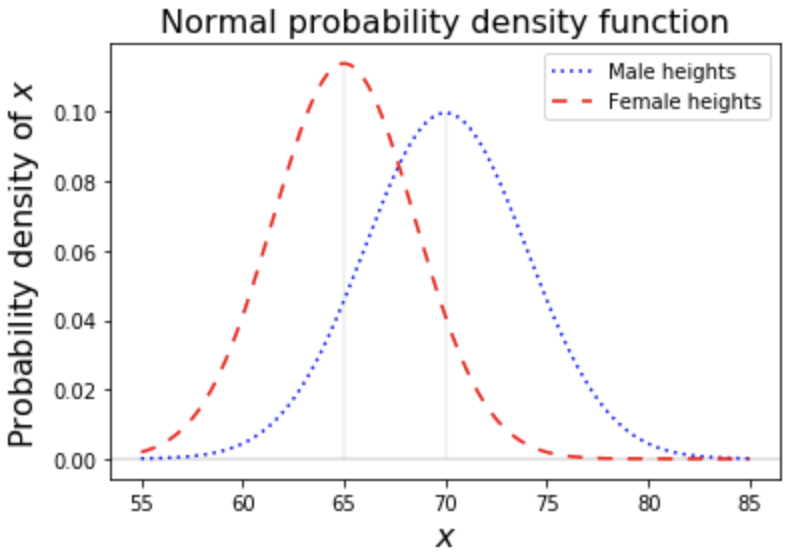
成年人的身高示例

男性与女性身高的正态概率密度

Python 概率基础

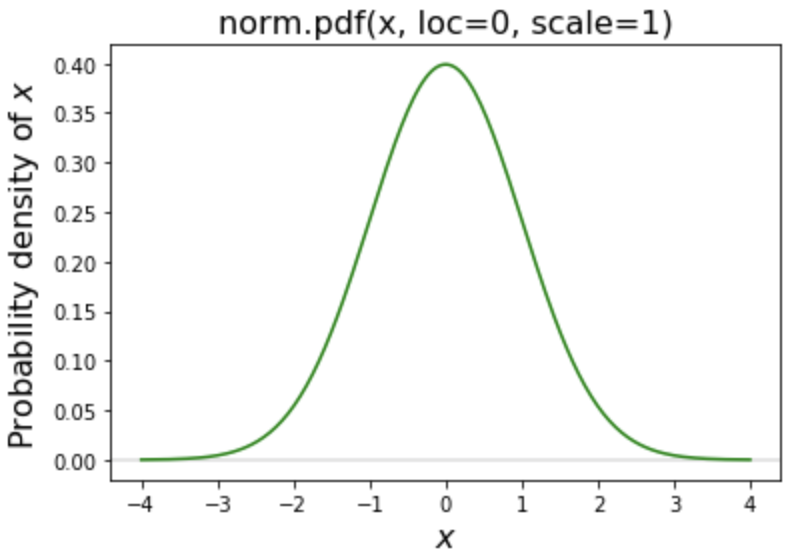
概率密度

标准正态的概率密度函数

Python 概率基础

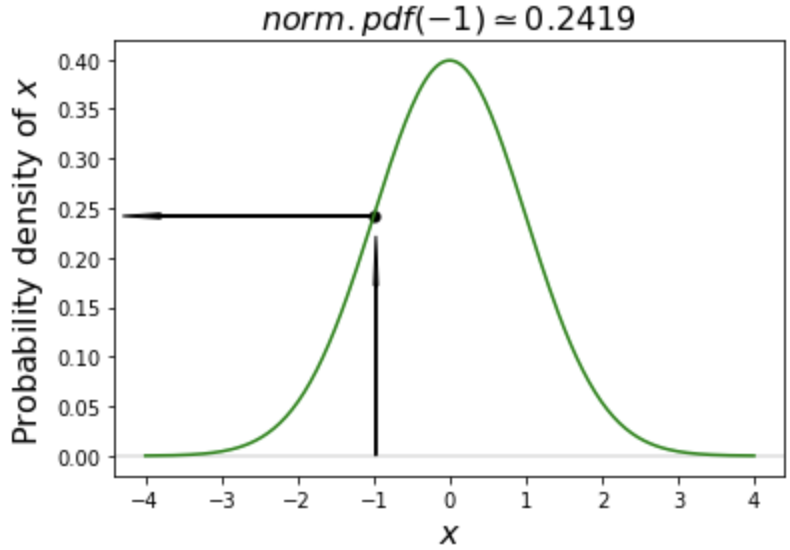
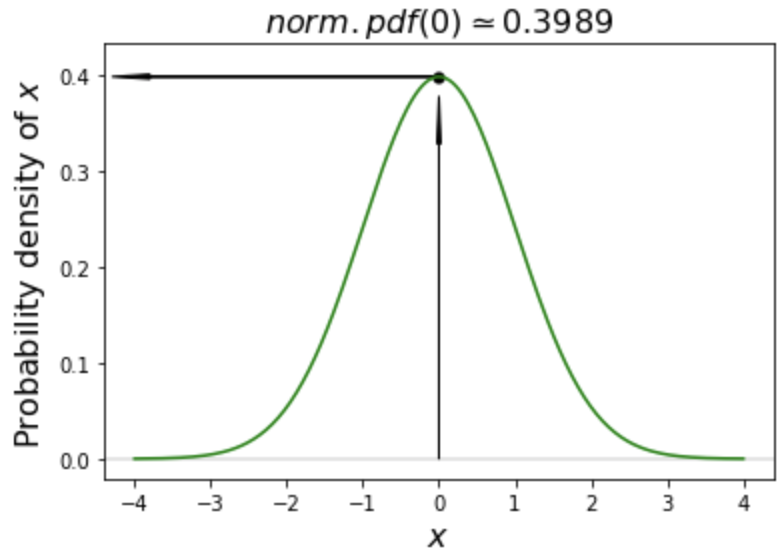
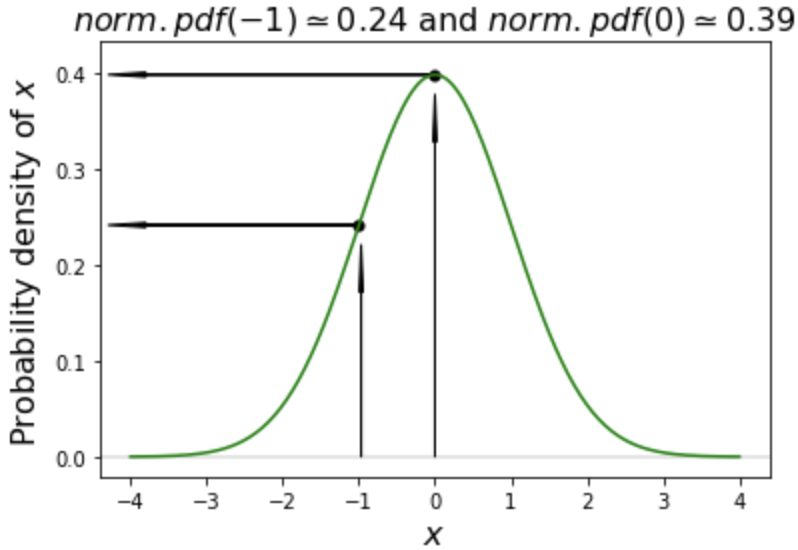
概率密度示例

$$ $$ 标准正态在 -1 处的概率密度函数

$$ $$ 标准正态在 0 处的概率密度函数

Python 概率基础

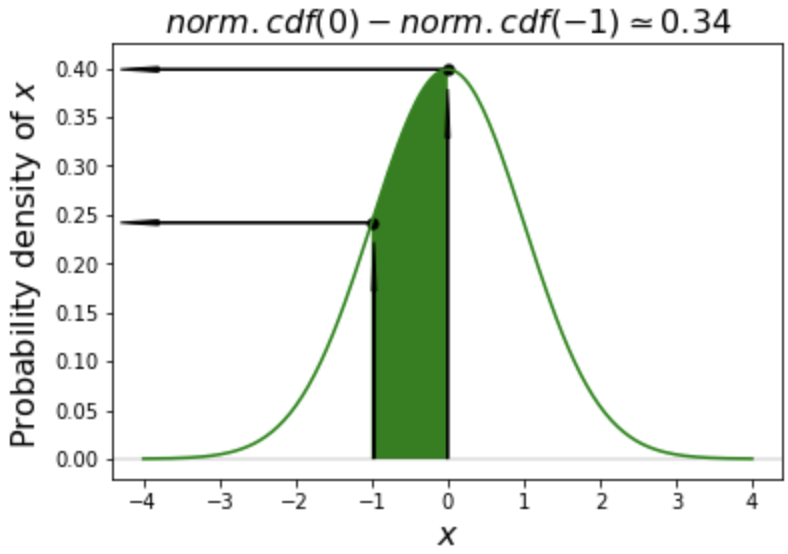
概率密度与概率

$$ $$ 标准正态的概率密度

$$ $$ 标准正态的概率为面积

Python 概率基础

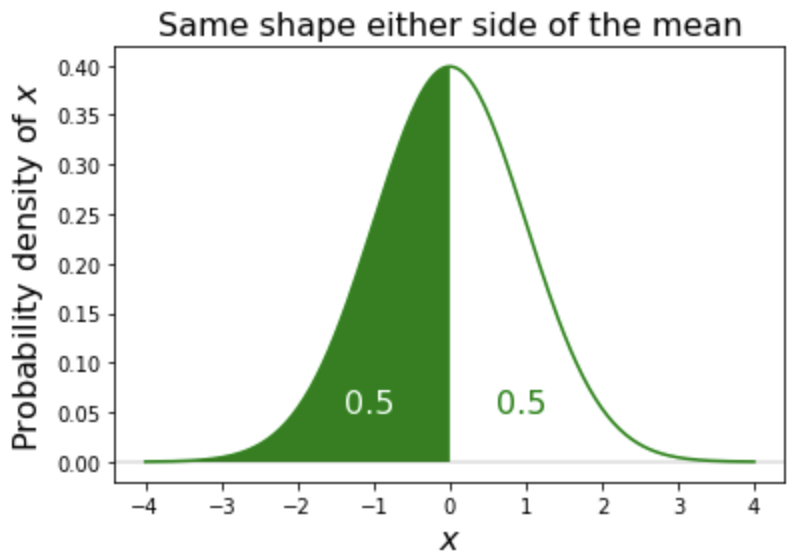
对称性

正态密度函数的对称形状

Python 概率基础

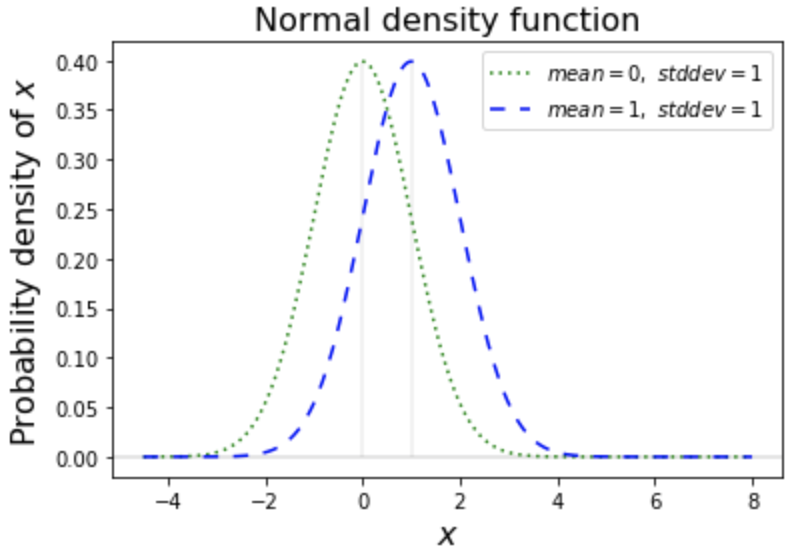
均值

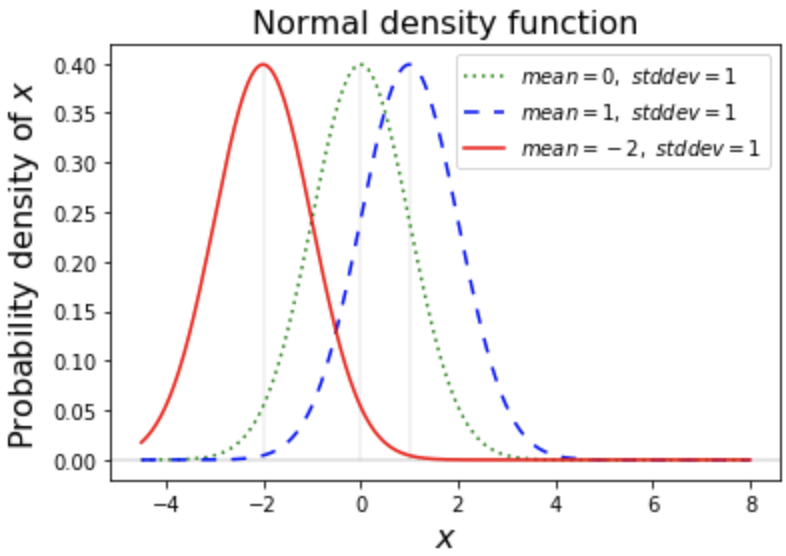
从正态密度看均值

Python 概率基础

均值(续)

均值为 1 的正态密度

Python 概率基础

均值(续)

均值为 -2 的正态密度

Python 概率基础

标准差

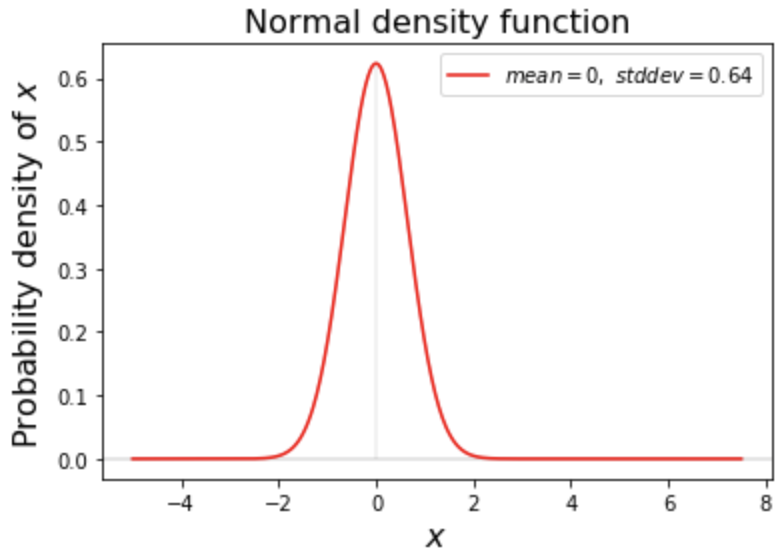
标准差为 0.64 的正态密度

Python 概率基础

标准差(续)

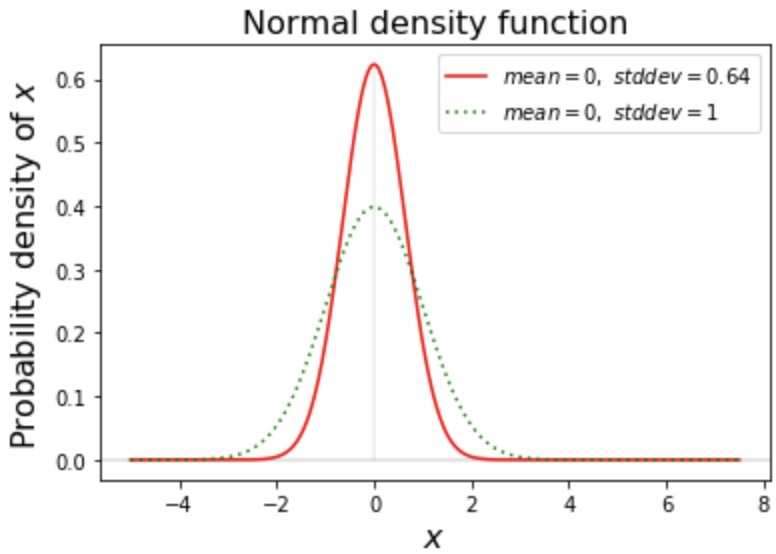
标准差为 1 的正态密度

Python 概率基础

标准差(续)

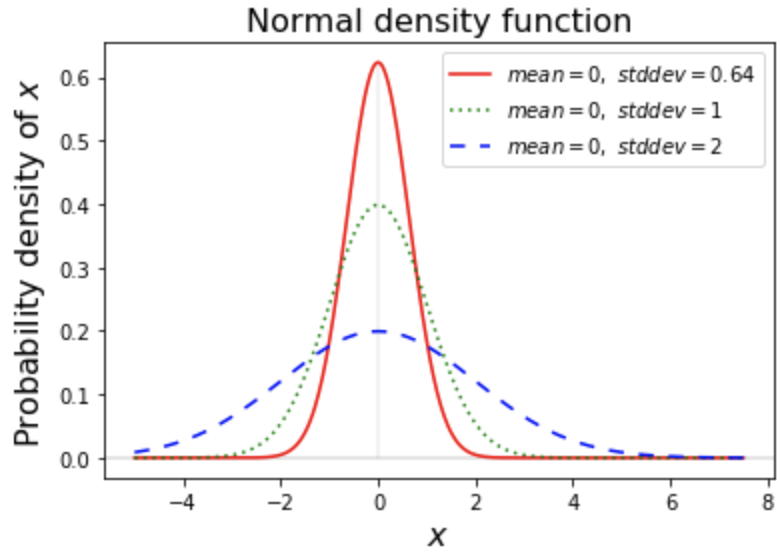
标准差为 2 的正态密度

Python 概率基础

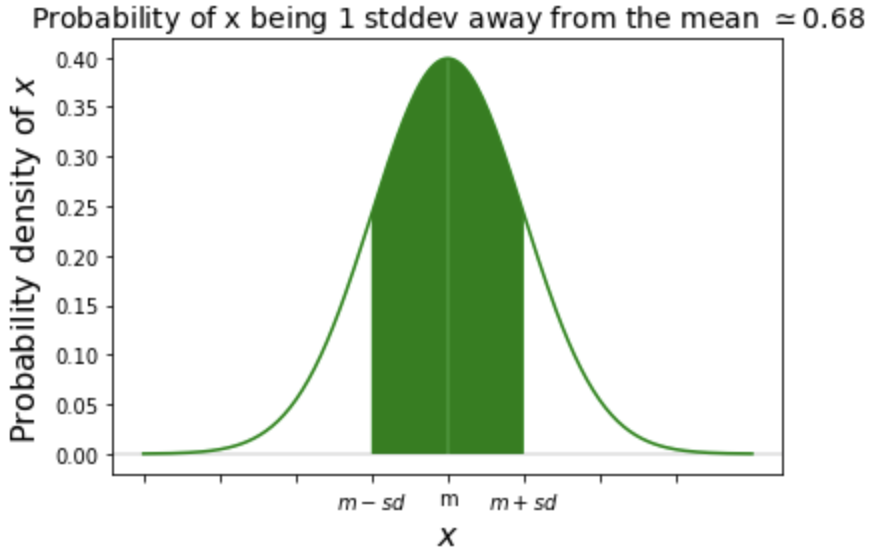
一个标准差

距均值 1 个标准差的概率图

Python 概率基础

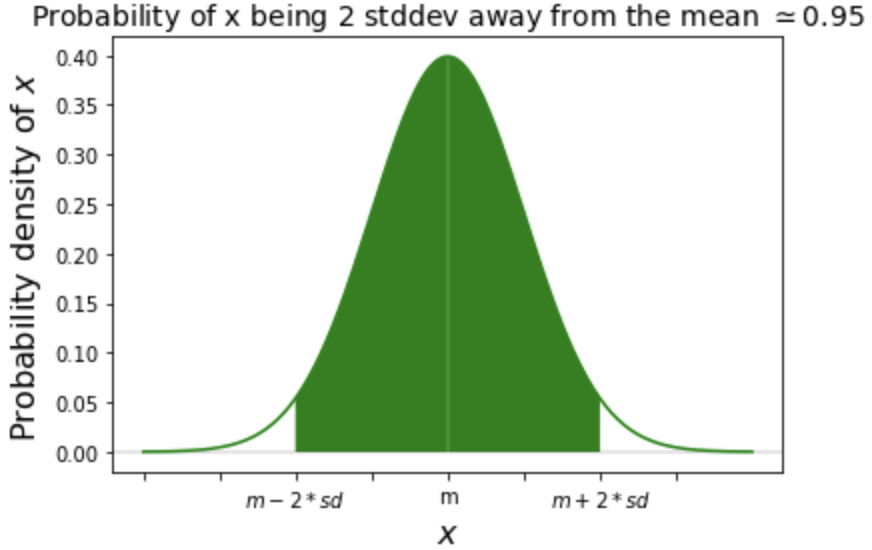
两个标准差

距均值 2 个标准差的概率图

Python 概率基础

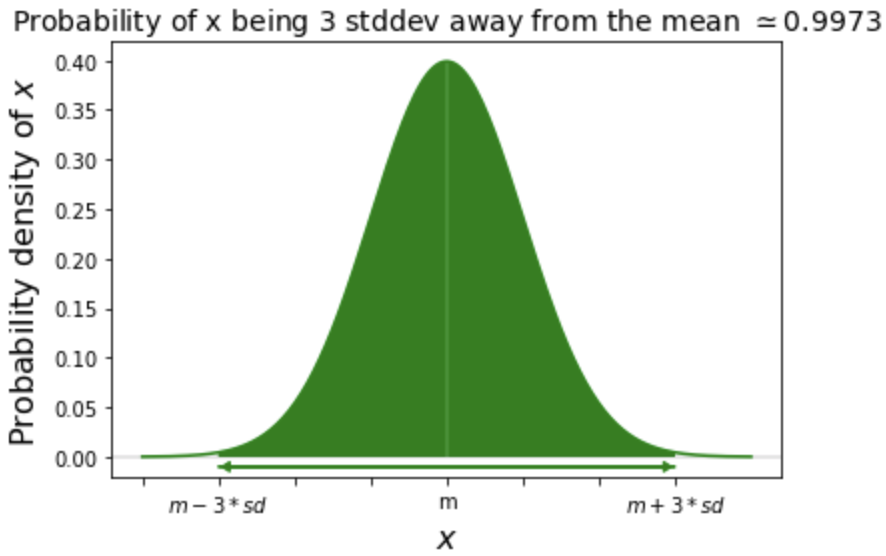
三个标准差

距均值 3 个标准差的概率图

Python 概率基础

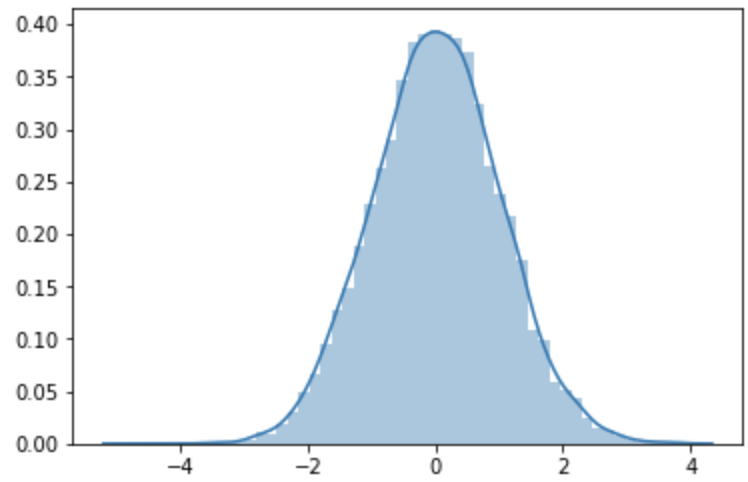
正态抽样

# Import norm, matplotlib.pyplot, and seaborn
from scipy.stats import norm
import matplotlib.pyplot as plt
import seaborn as sns
# Create the sample using norm.rvs()
sample = norm.rvs(loc=0, scale=1, size=10000, random_state=13)
# Plot the sample
sns.distplot(sample)
plt.show()
Python 概率基础

正态抽样(续)

样本的概率密度图

Python 概率基础

做些正态分布练习吧

Python 概率基础

Preparing Video For Download...