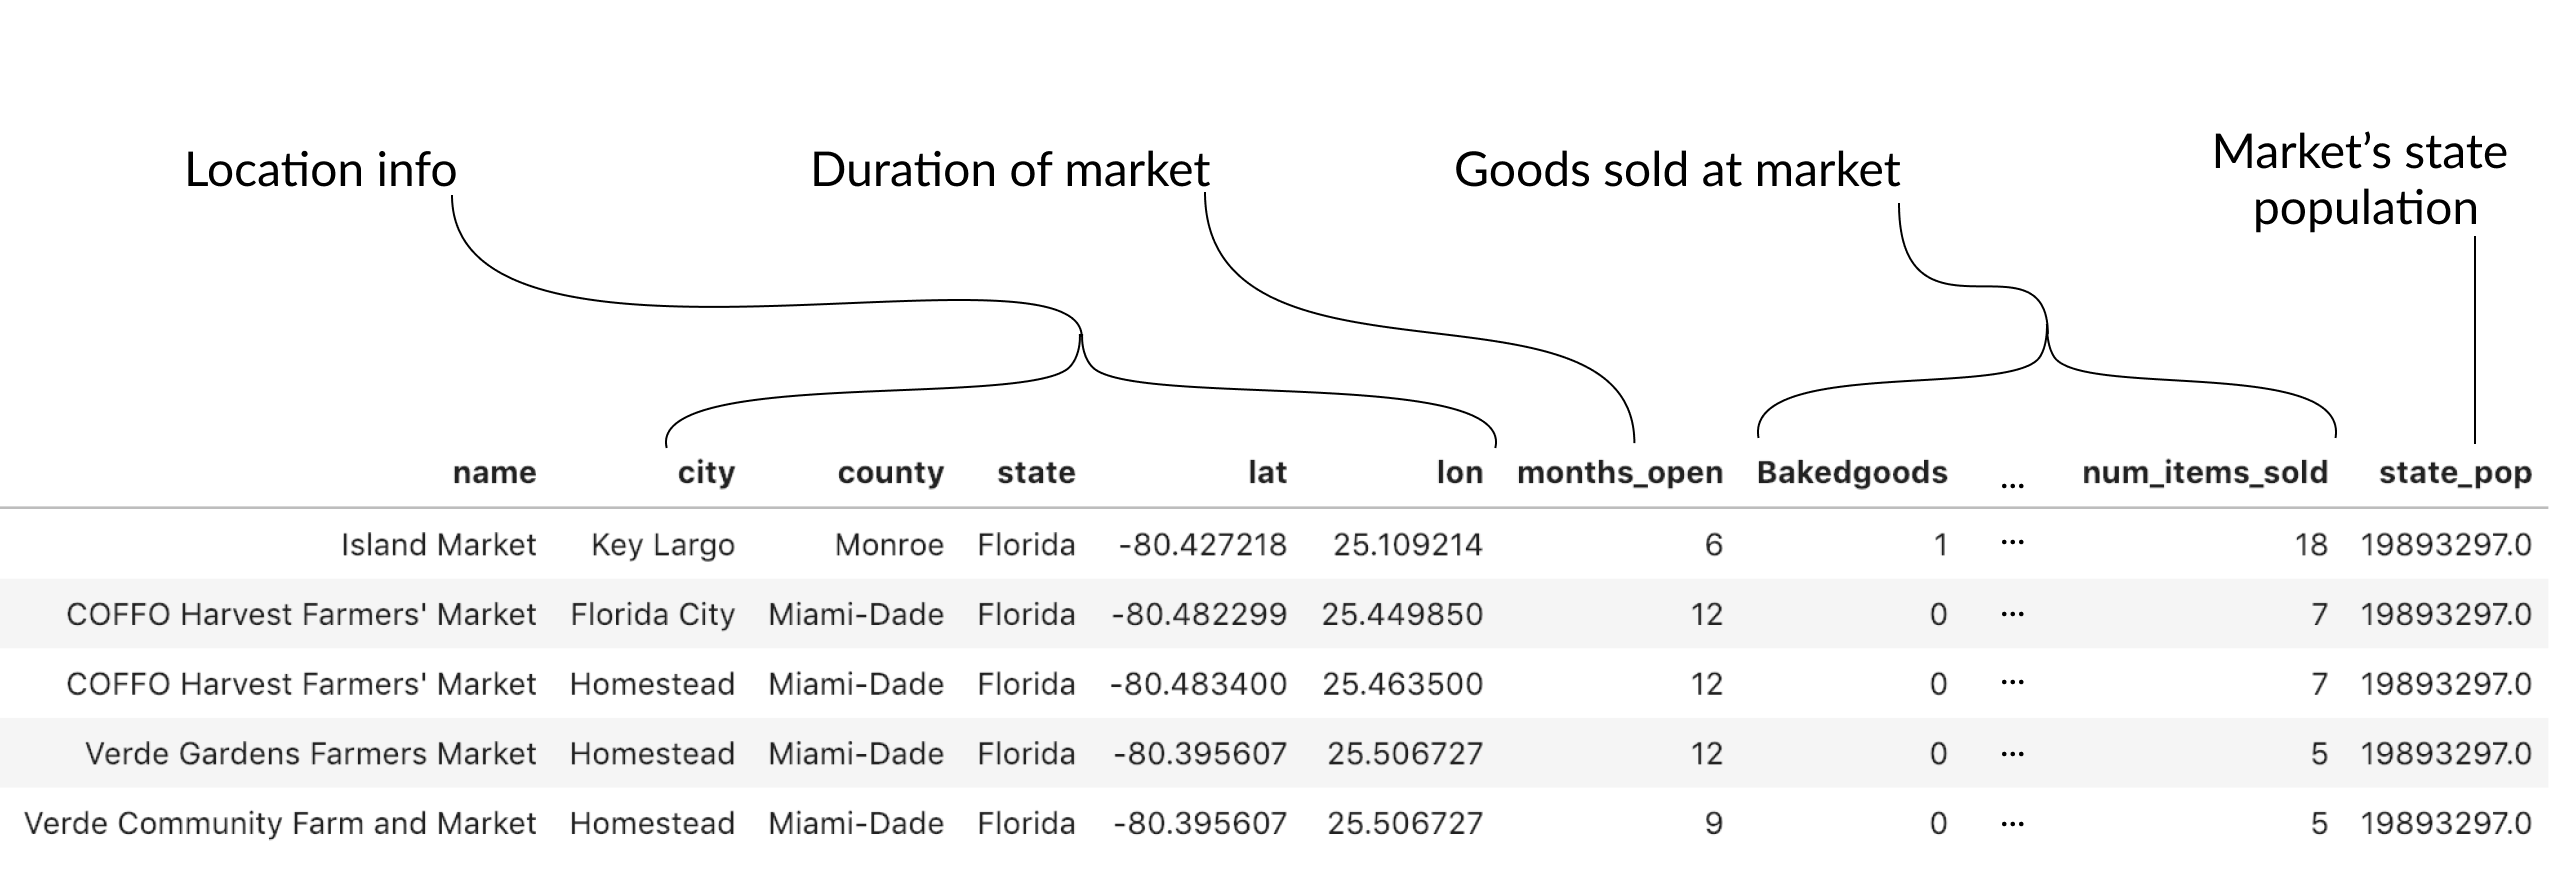
查看农贸市场数据
用 Python 提升数据可视化

Nick Strayer
Instructor
数据集的首次探索

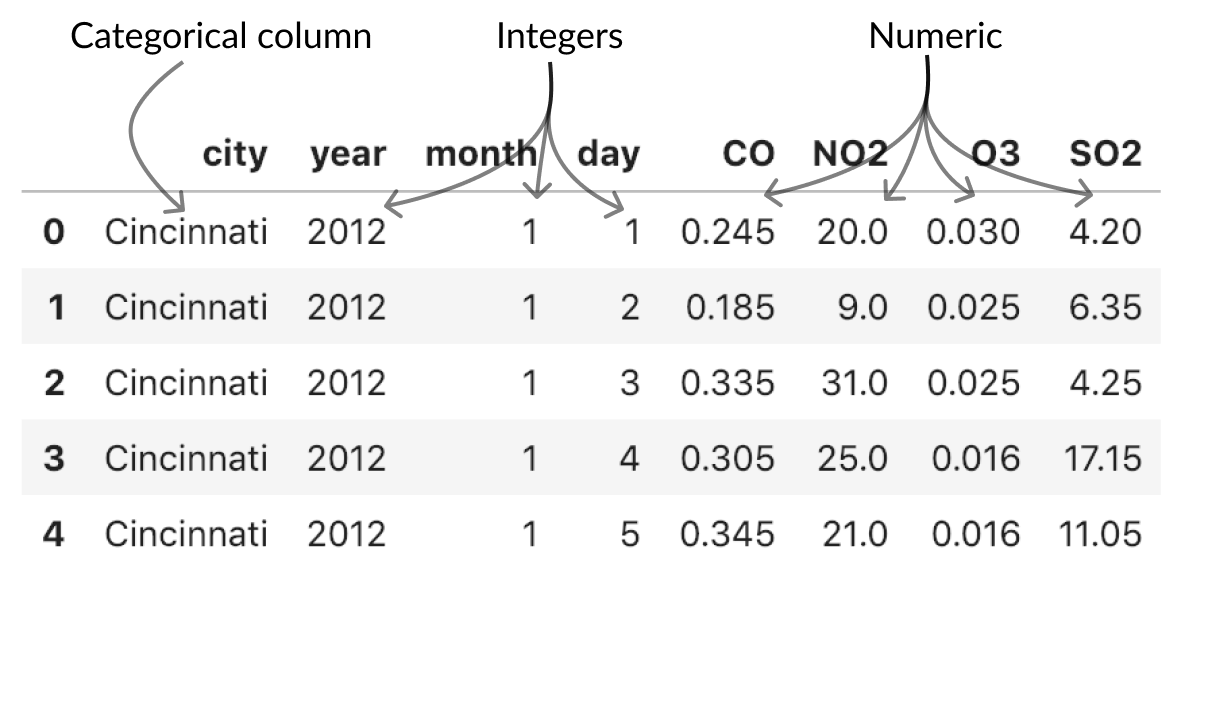
使用 head()
pollution.head()
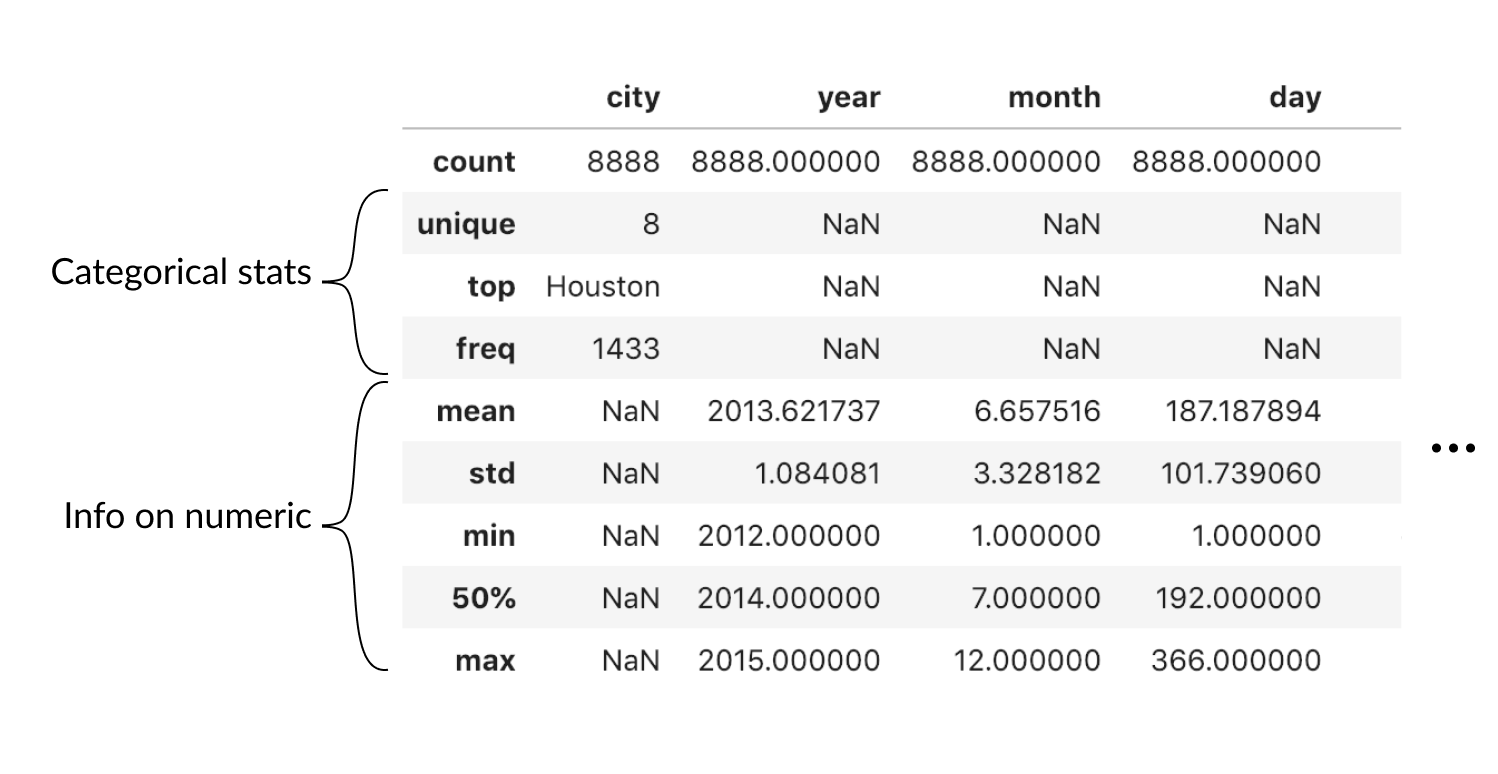
# 仅显示中位数
pollution.describe(percentiles=[0.5]
                   # 汇总所有列
                   include='all')
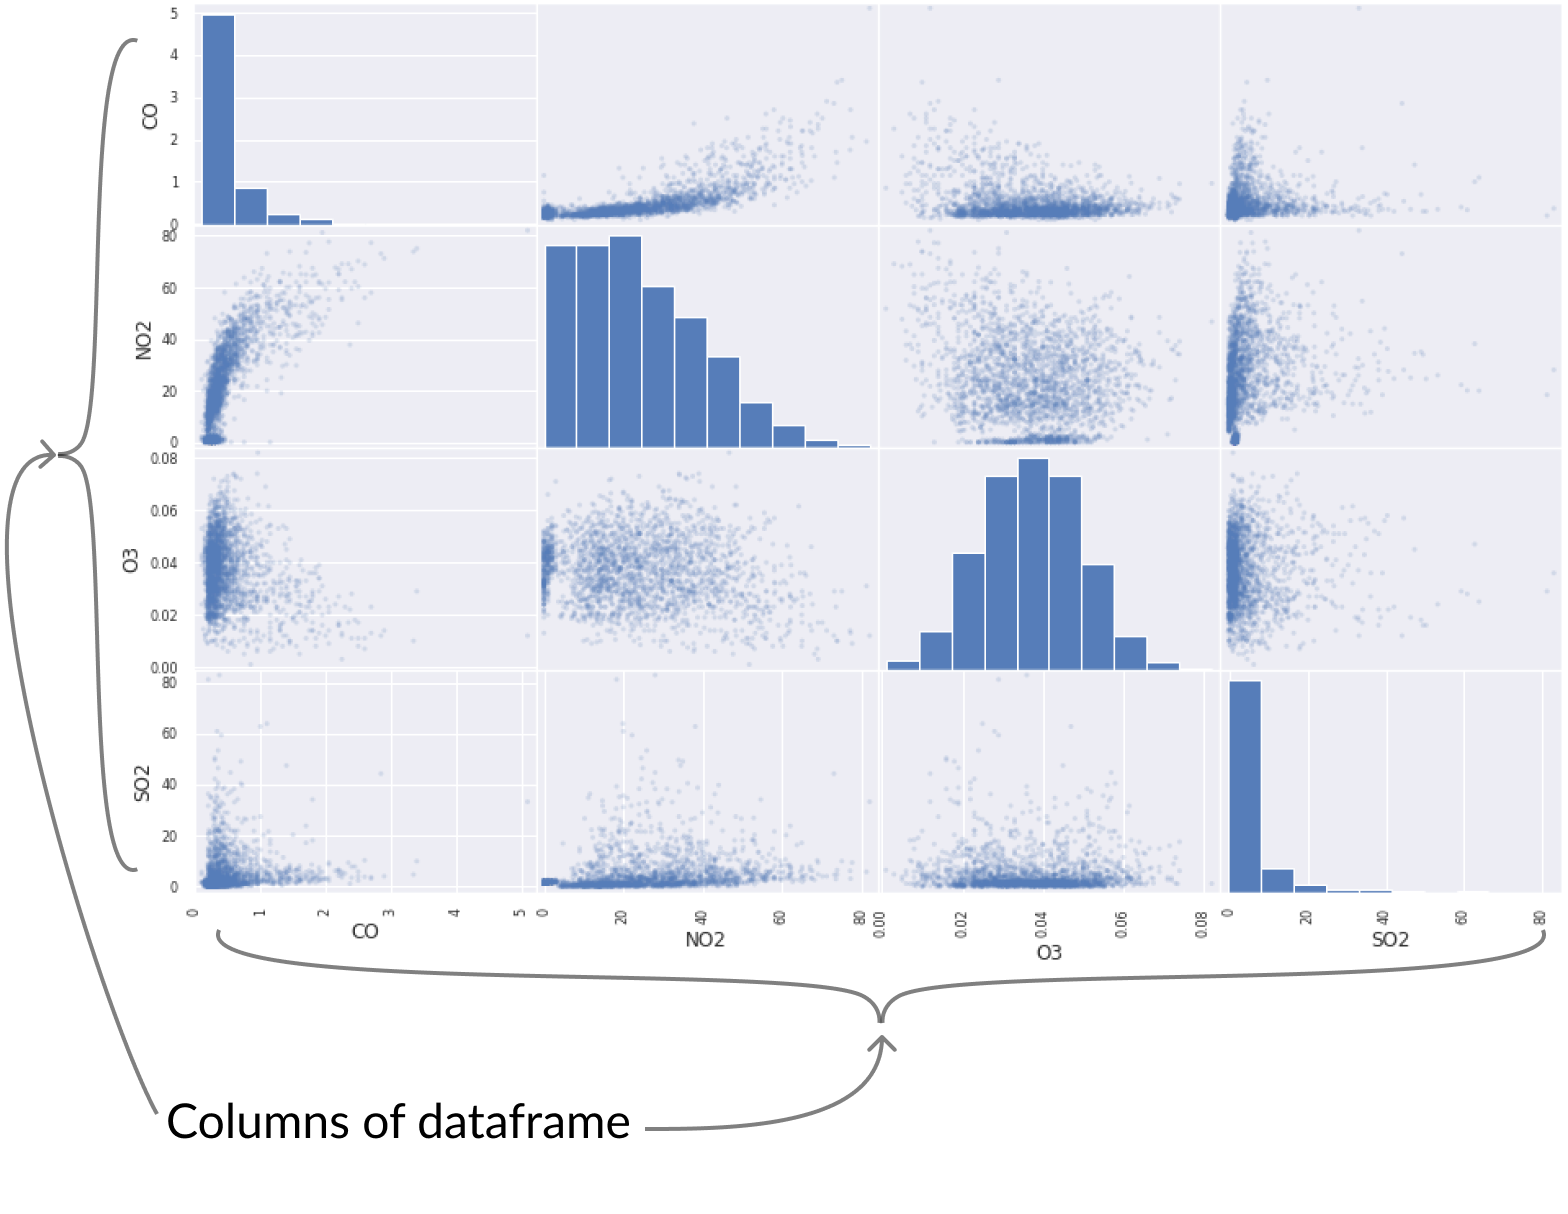
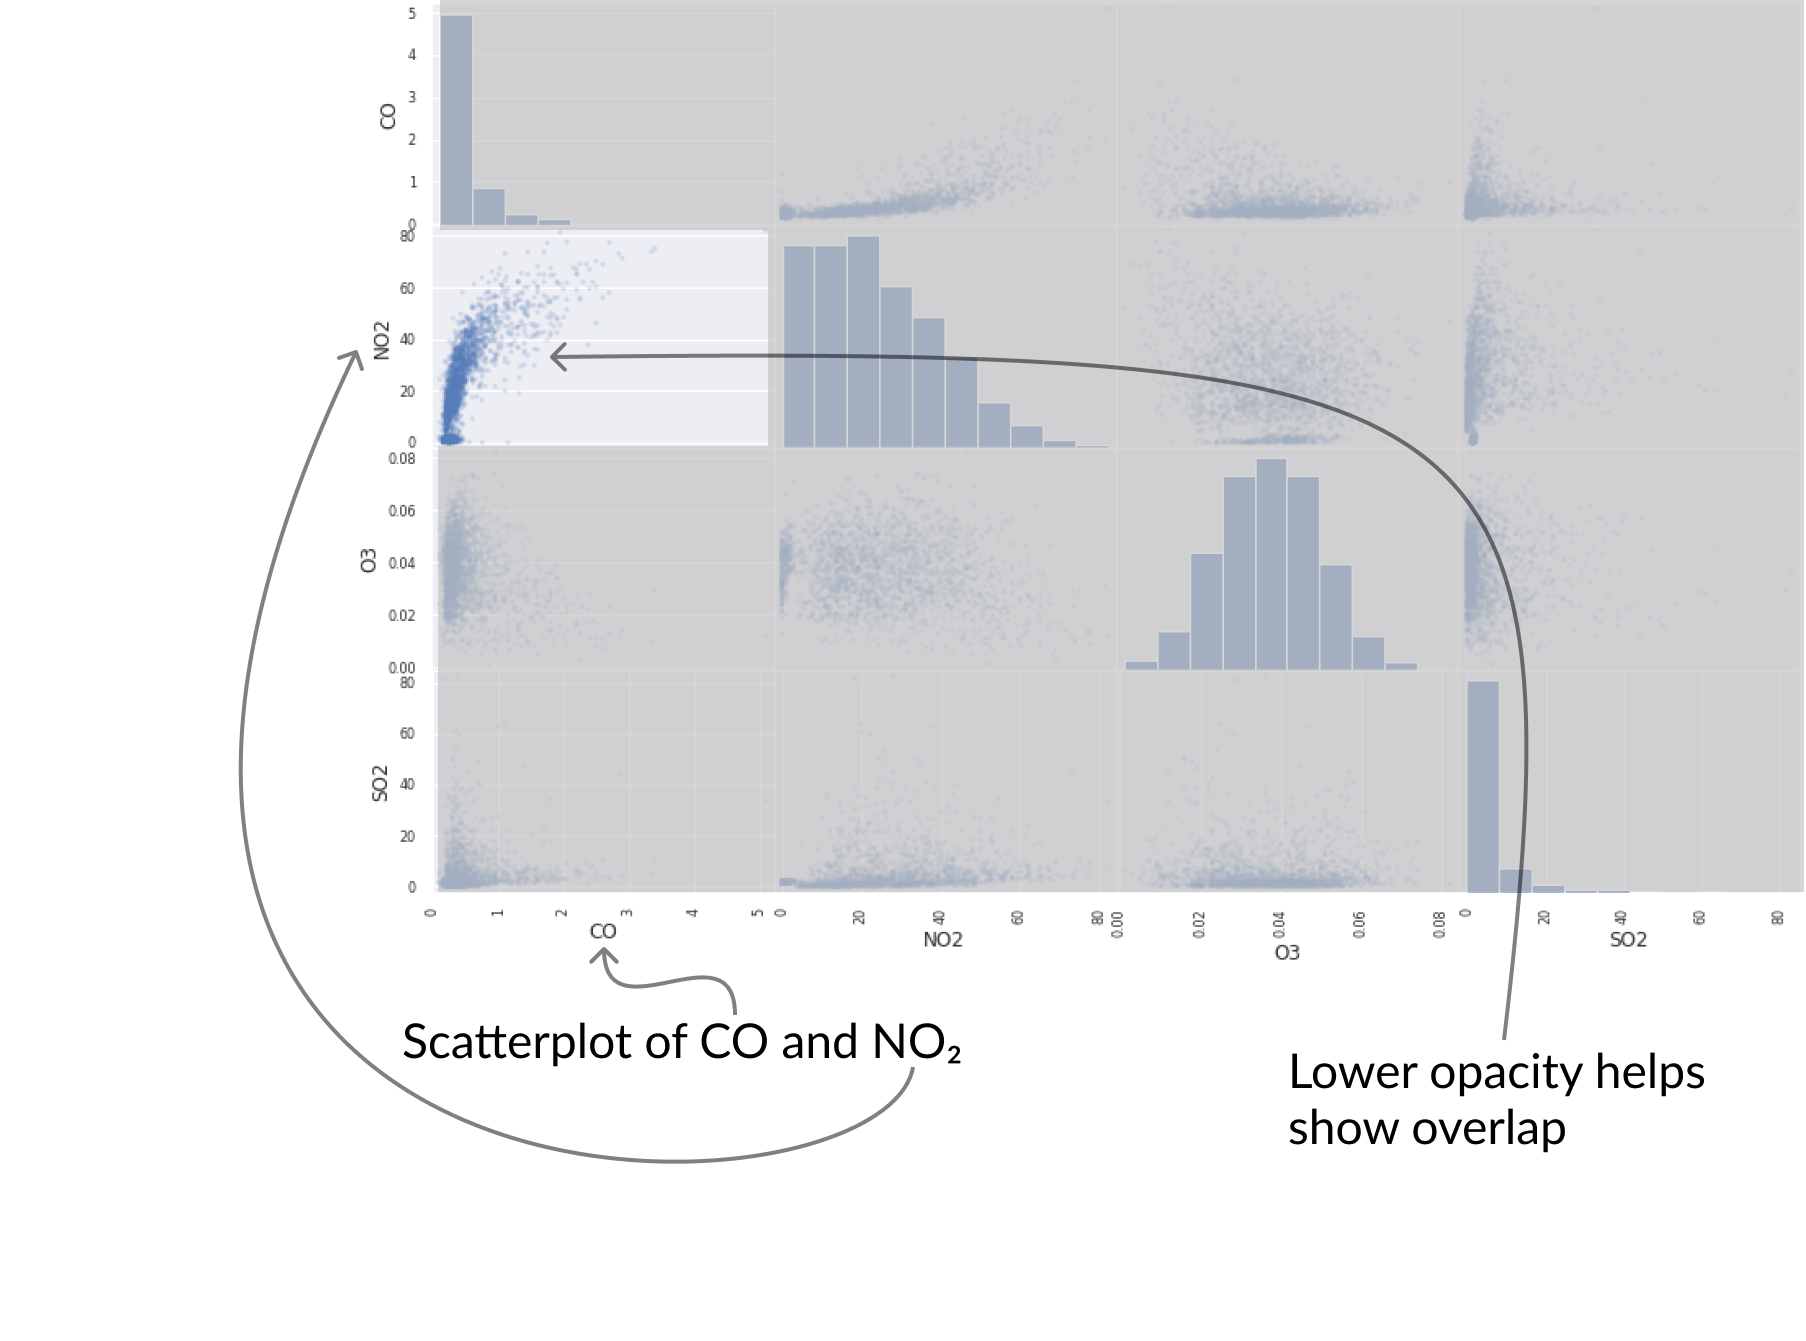
pd.plotting.scatter_matrix(pollution, alpha = 0.2);

markets.head()