数学近似
R 中的线性回归推断

Jo Hardin
Professor, Pomona College

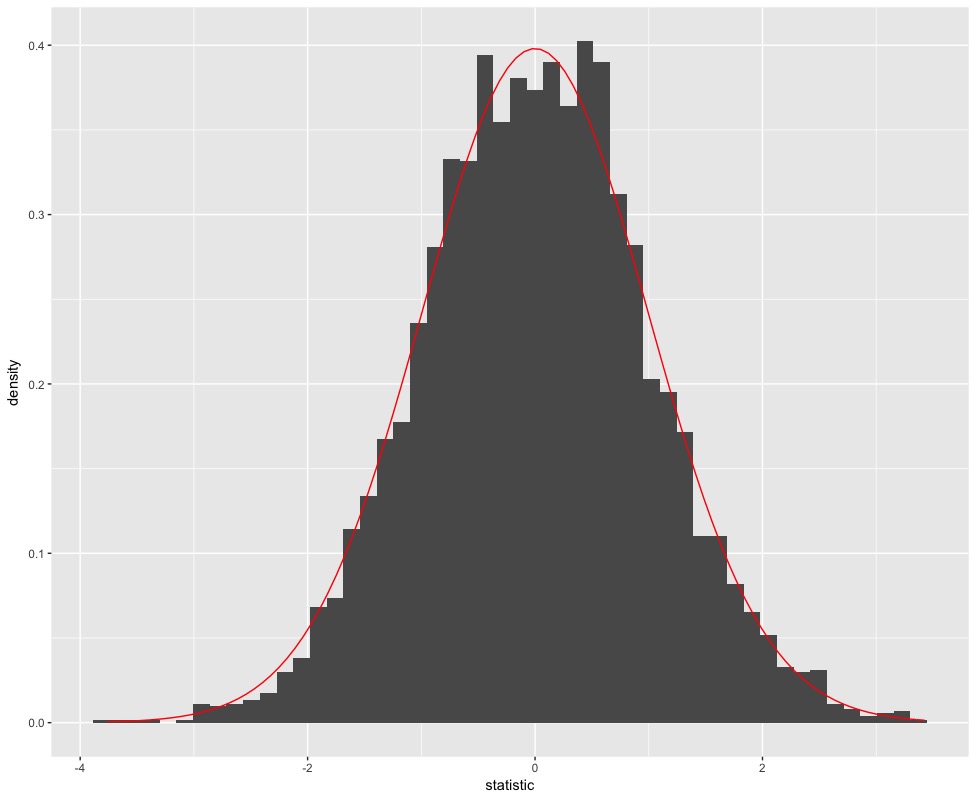
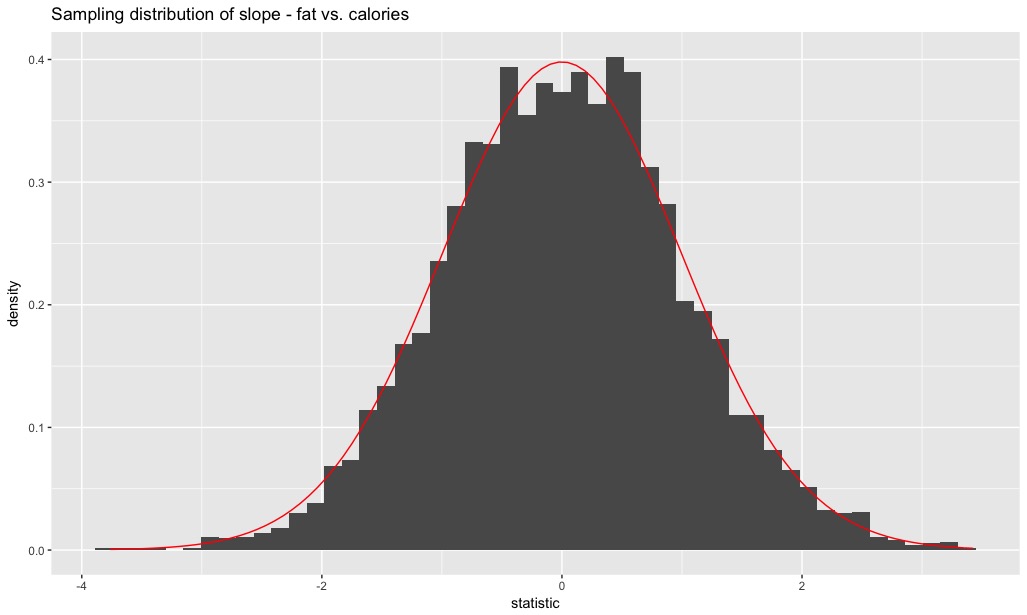
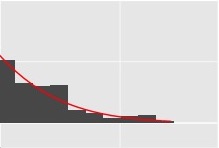
斜率的抽样分布:t 拟合良好
ggplot(starFatCal, aes(x = statistic)) +
  geom_histogram(aes(y = ..density..), bins = 50) +
  stat_function(fun = dt, color = "red", args = list(df = nrow(starbucks) - 2))
模型拟合
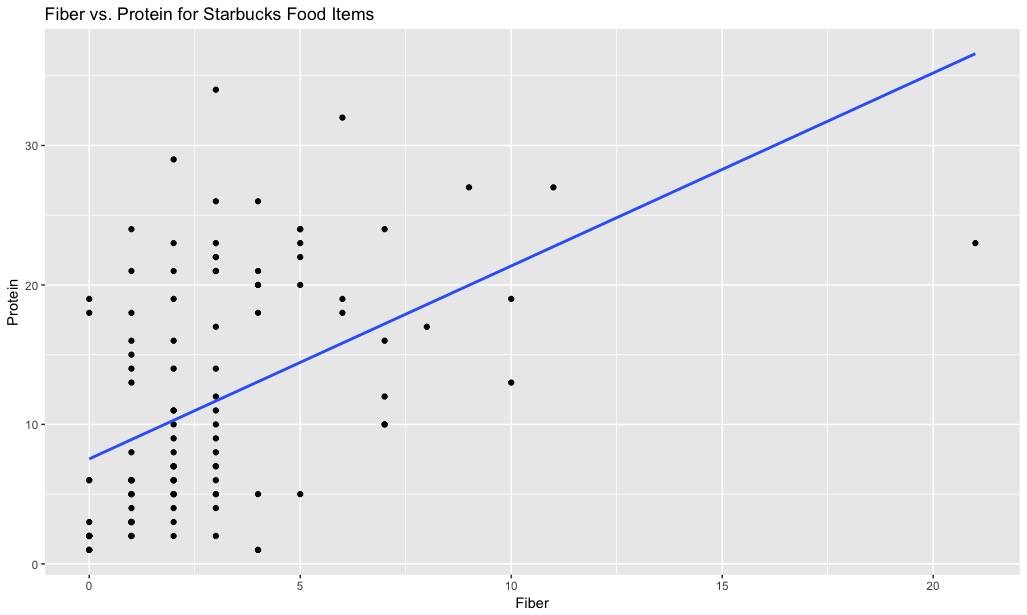
斜率的抽样分布:t 拟合较差
ggplot(starProFib, aes(x = statistic)) + geom_histogram(aes(y = ..density..), bins = 50) +
  stat_function(fun = dt, color = "red", args = list(df = nrow(starbucks) - 2))
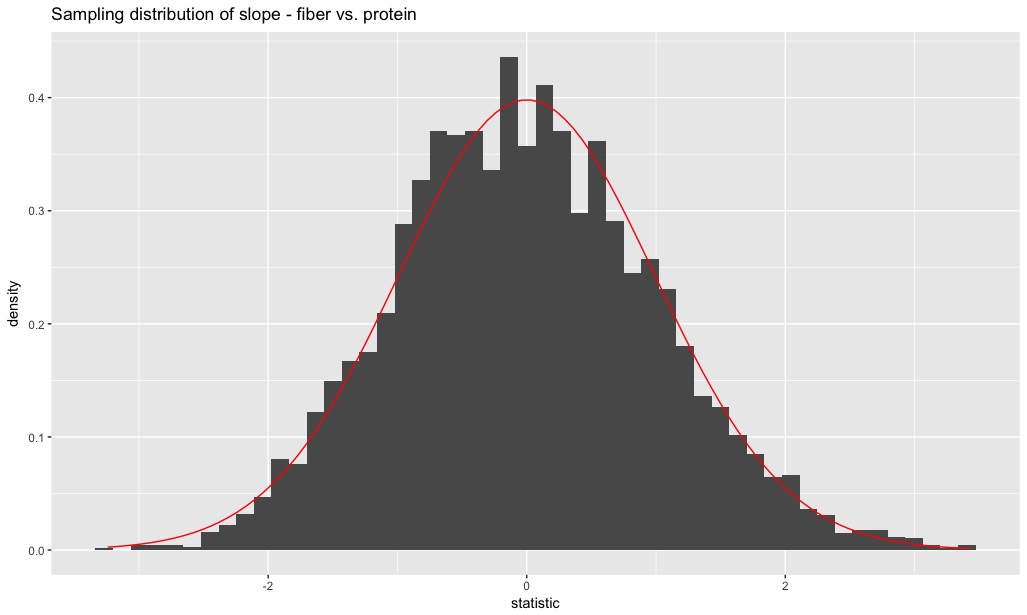
斜率的抽样分布:t 拟合较差
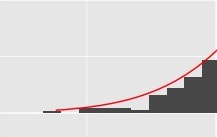
斜率的抽样分布:t 拟合较差