斯皮尔曼秩相关

R 中的 A/B 测试

Lauryn Burleigh

Data Scientist

斯皮尔曼相关的假设

  • 秩次:按位置排序
  • 斯皮尔曼相关高:两变量位置相近
  • 连续或离散数据
    • 序数、区间或比率

四个柱从高到低排列,最高为 1,最低为 4。

R 中的 A/B 测试

单调关系

  • 斯皮尔曼相关(rho):单调关系

    • 不持续单增或单减
  • 单调性比线性更宽松

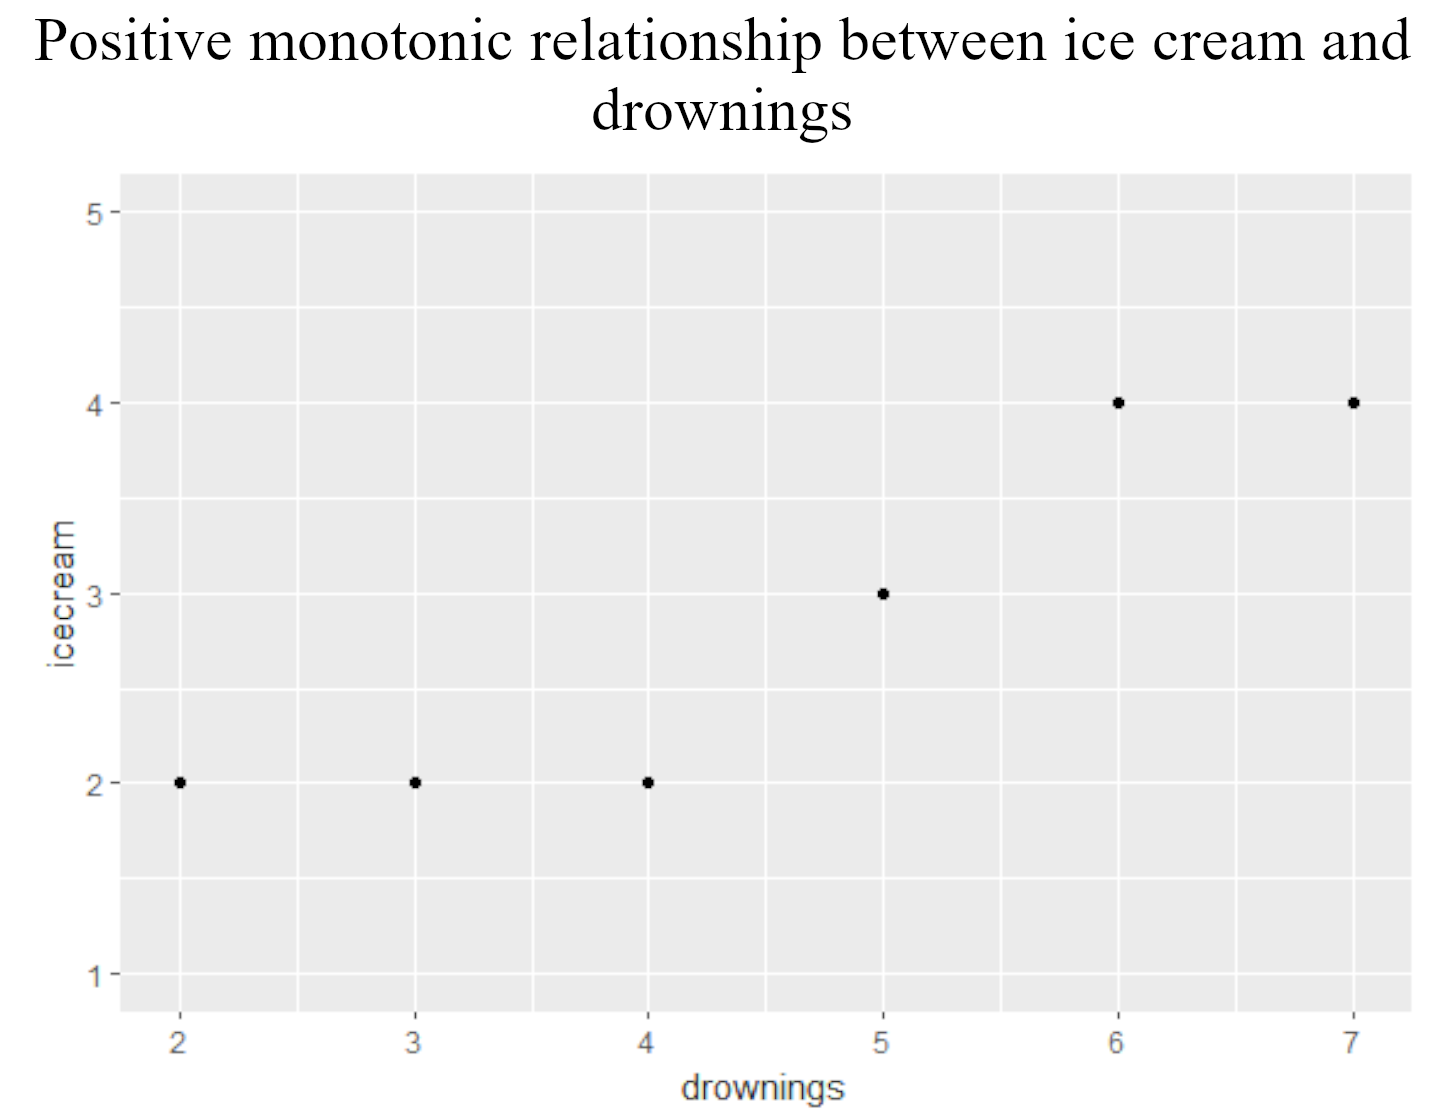
ggplot(data, aes(x = drownings, 
                 y = icecream)) +
  geom_point()

散点图:随溺水人数增加,冰淇淋先平稳后上升再平稳,呈单调增加关系。

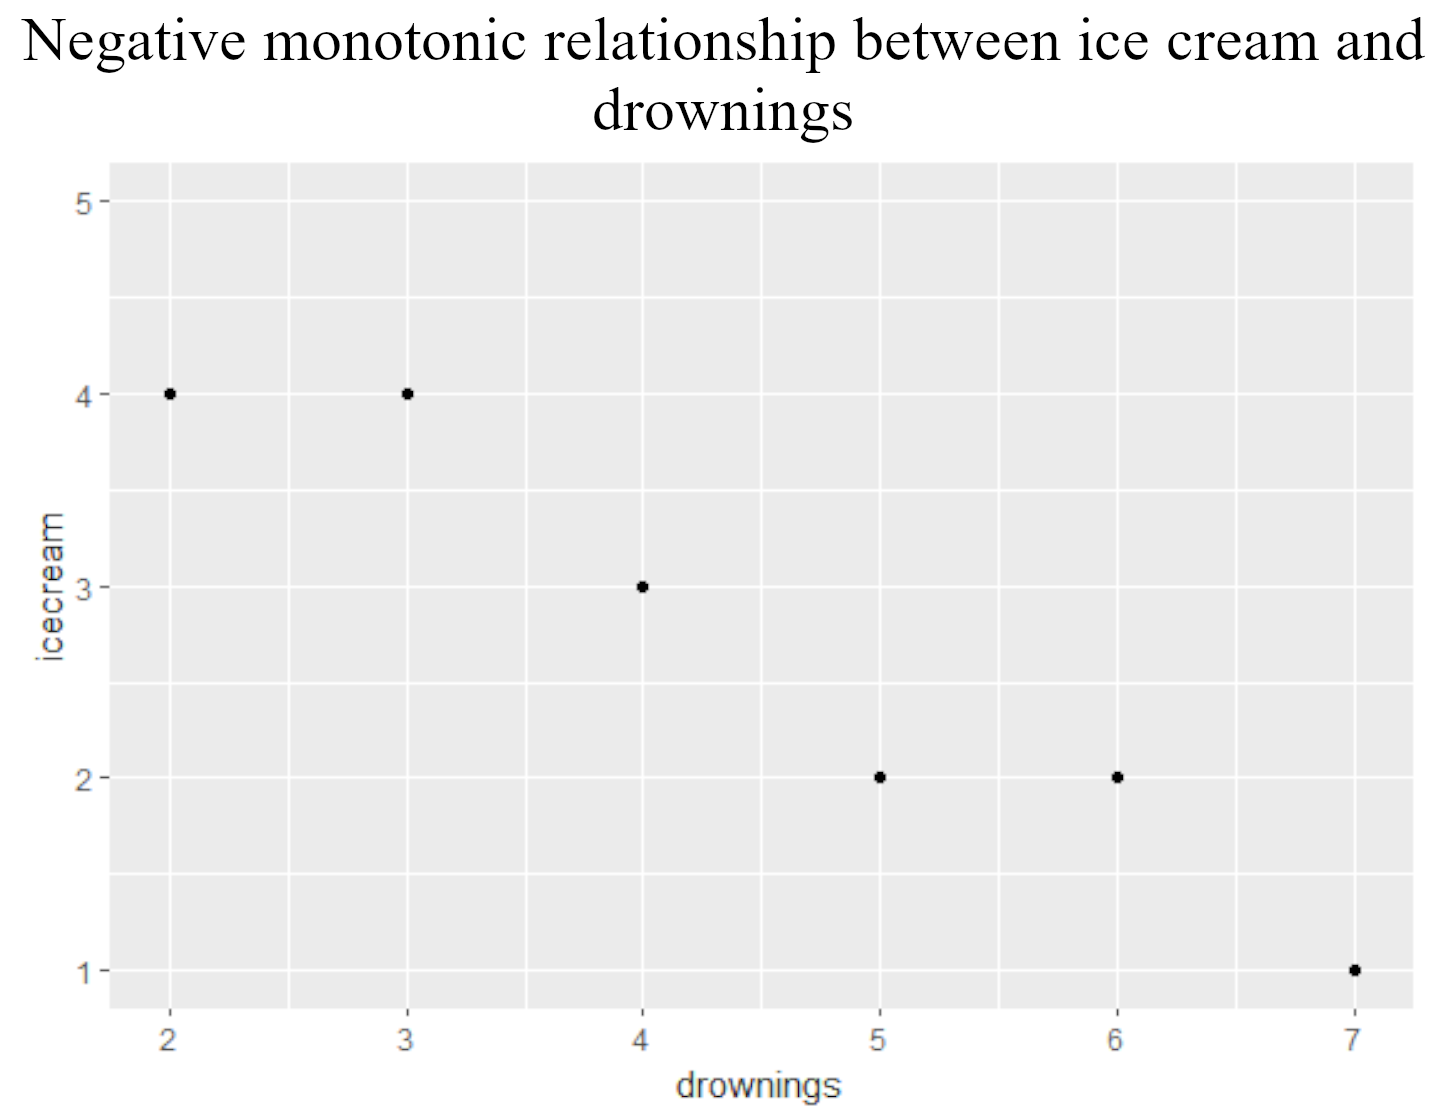
散点图:随溺水人数增加,冰淇淋先平稳后下降再平稳再下降,呈单调减少关系。

R 中的 A/B 测试

假设与样本量

  • 原假设:时间与披萨享受度无单调关联
library(pwr)
pwr.r.test(r = 0.3, power = 0.80, 
           sig.level = 0.05)
    approximate correlation power 
 calculation (arctangh transformation) 

              n = 84.07364
              r = 0.3
      sig.level = 0.05
          power = 0.8
    alternative = two.sided
R 中的 A/B 测试

忽略分组的斯皮尔曼

cor.test(~ enjoyment + time, 
         data = pizza, 
         method = "spearman", 
        exact = FALSE)
    Spearman's rank correlation rho
data:  time and enjoyment
S = 2, p-value = .003245
alternative hypothesis: true rho is 
not equal to 0
sample estimates:
      rho 
0.9984962 
samp <- length(pizza$time)
[1]  90
R 中的 A/B 测试

组内的斯皮尔曼

cor.test(~ enjoyment + time, 
         data = pizza, 
         subset = 
             (Topping == "Cheese"),
         method = "spearman",
         exact = FALSE)
    Spearman's rank correlation rho
data:  time and enjoyment
S = 1.2434e-14, p-value = 0.0003968
alternative hypothesis: true rho is 
not equal to 0
sample estimates:
rho 
  1 
ggplot(pizza, aes(x = enjoyment, 
                  y = time, 
                  color = Topping)) + 
  geom_point()
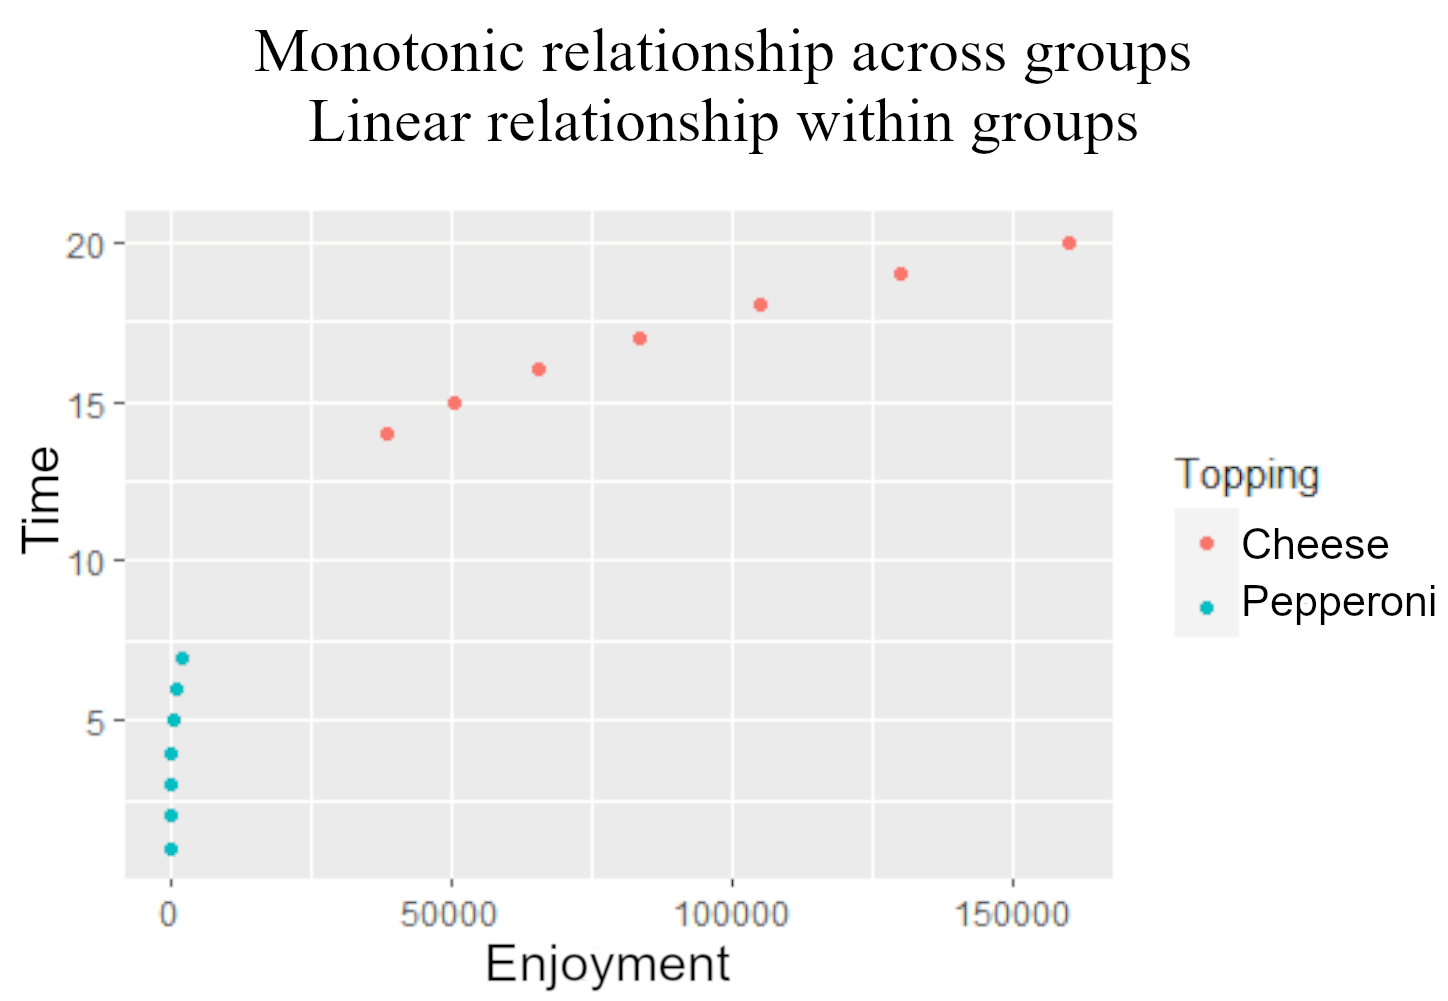
蓝色的芝士组在 x 轴左侧呈陡峭正斜率,粉色的意大利香肠组在右侧呈较缓的正斜率。

R 中的 A/B 测试

斯皮尔曼效能分析

library(pwr)
pwr.r.test(r = 0.998, n = 90, 
           sig.level = 0.003)
     approximate correlation power 
  calculation (arctangh transformation) 

              n = 90
              r = 0.998
      sig.level = 0.003
          power = 1
    alternative = two.sided
R 中的 A/B 测试

引用输出结果

rhotest <- cor.test(~ enjoyment + time, 
         data = pizza, 
         method = "spearman")
samp <- length(pizza$time)
library(pwr)
pwr.r.test(r = rhotest$estimate, 
           sig.level = rhotest$p.value,
           n = samp)
     approximate correlation power 
  calculation (arctangh transformation) 

              n = 90
              r = 0.998
      sig.level = 0.003
          power = 1
    alternative = two.sided
R 中的 A/B 测试

开始练习吧!

R 中的 A/B 测试

Preparing Video For Download...