用 Python 可视化时间序列数据
Thomas Vincent
Head of Data Science, Getty Images
t_1
t_2
t_3
t_4
t_5
t_6
statsmodels 是一个 Python 模块,提供用于估计多种统计模型的类与函数,并可进行统计检验和数据探索。
statsmodels
import matplotlib.pyplot as plt
from statsmodels.graphics import tsaplots
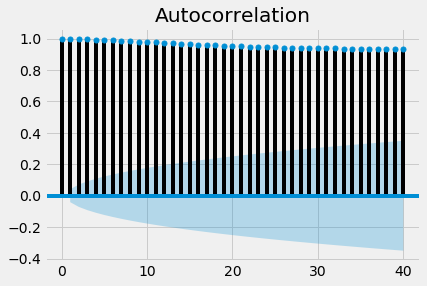
fig = tsaplots.plot_acf(co2_levels['co2'], lags=40)

plt.show()
order 3
t1
t2
t3
t4
t5
t6
import matplotlib.pyplot as plt

from statsmodels.graphics import tsaplots
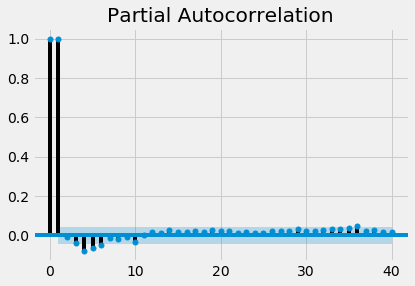
fig = tsaplots.plot_pacf(co2_levels['co2'], lags=40)

plt.show()