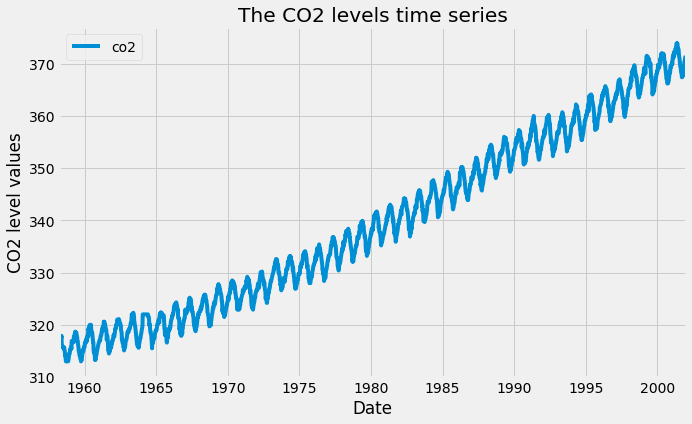
时间序列中的季节性、趋势与噪声

用 Python 可视化时间序列数据

Thomas Vincent

Head of Data Science, Getty Images

时间序列的属性

时间序列的属性

用 Python 可视化时间序列数据

时间序列的属性

  • 季节性:数据是否呈现清晰的周期模式?
  • 趋势:数据是否持续上升或下降?
  • 噪声:是否有与整体不一致的离群点或缺失值?
用 Python 可视化时间序列数据

时间序列分解

import statsmodels.api as sm
import matplotlib.pyplot as plt
from pylab import rcParams

rcParams['figure.figsize'] = 11, 9
decomposition = sm.tsa.seasonal_decompose(
                co2_levels['co2'])
fig = decomposition.plot()

plt.show()
用 Python 可视化时间序列数据

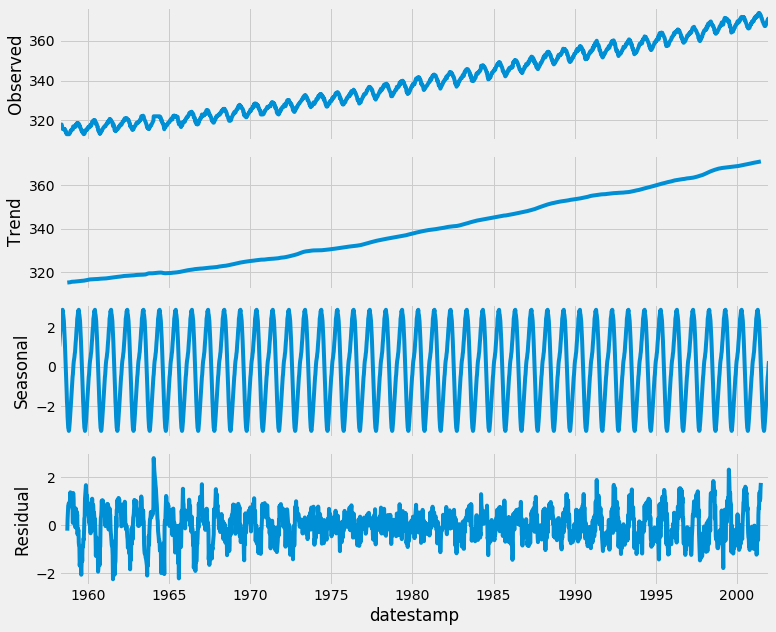
CO2 数据的时间序列分解图

时间序列分解

用 Python 可视化时间序列数据

从分解中提取时间序列成分

print(dir(decomposition))
['__class__', '__delattr__', '__dict__',
 ... 'plot', 'resid', 'seasonal', 'trend']
print(decomposition.seasonal)
datestamp
1958-03-29    1.028042
1958-04-05    1.235242
1958-04-12    1.412344
1958-04-19    1.701186
用 Python 可视化时间序列数据

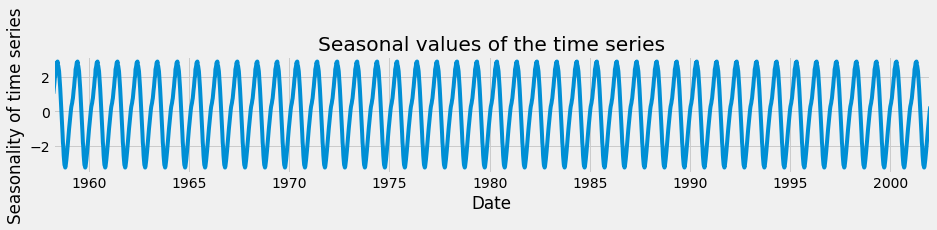
时间序列的季节性成分

decomp_seasonal = decomposition.seasonal

ax = decomp_seasonal.plot(figsize=(14, 2))
ax.set_xlabel('Date')
ax.set_ylabel('Seasonality of time series')
ax.set_title('Seasonal values of the time series')

plt.show()
用 Python 可视化时间序列数据

时间序列的季节性成分

时间序列中的季节性

用 Python 可视化时间序列数据

时间序列的趋势成分

decomp_trend = decomposition.trend

ax = decomp_trend.plot(figsize=(14, 2))
ax.set_xlabel('Date')
ax.set_ylabel('Trend of time series')
ax.set_title('Trend values of the time series')

plt.show()
用 Python 可视化时间序列数据

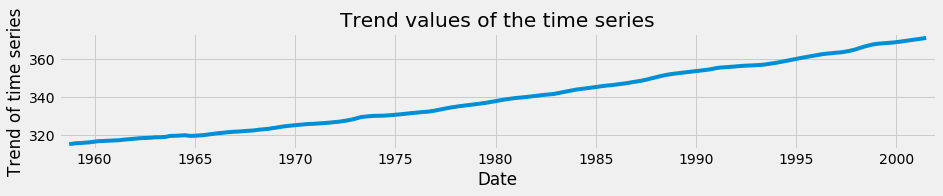
时间序列的趋势成分

时间序列中的趋势

用 Python 可视化时间序列数据

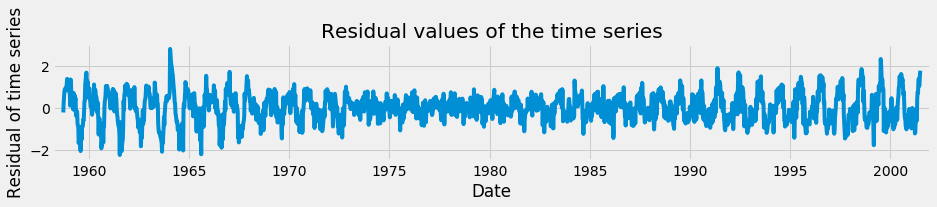
时间序列的噪声成分

decomp_resid = decomp.resid

ax = decomp_resid.plot(figsize=(14, 2))
ax.set_xlabel('Date')
ax.set_ylabel('Residual of time series')
ax.set_title('Residual values of the time series')

plt.show()
用 Python 可视化时间序列数据

时间序列的噪声成分

时间序列中的噪声

用 Python 可视化时间序列数据

让我们练习吧!

用 Python 可视化时间序列数据

Preparing Video For Download...