大规模枪击案

使用 R 构建 Shiny Web 应用

Ramnath Vaidyanathan

VP of Product Research

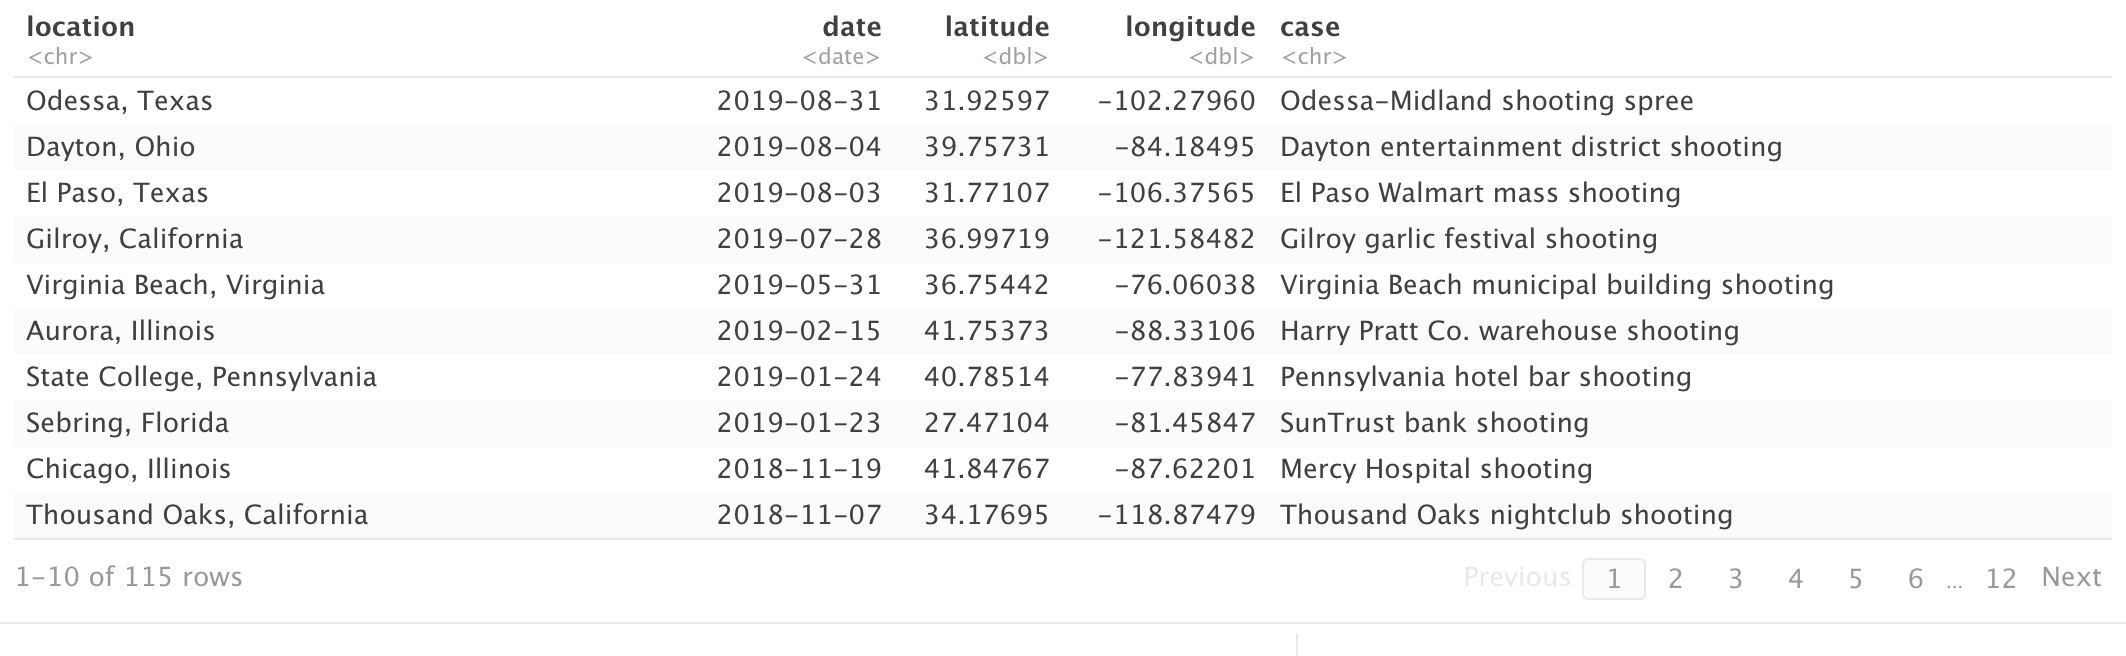
探索数据

大规模枪击数据集的前 10 行

使用 R 构建 Shiny Web 应用

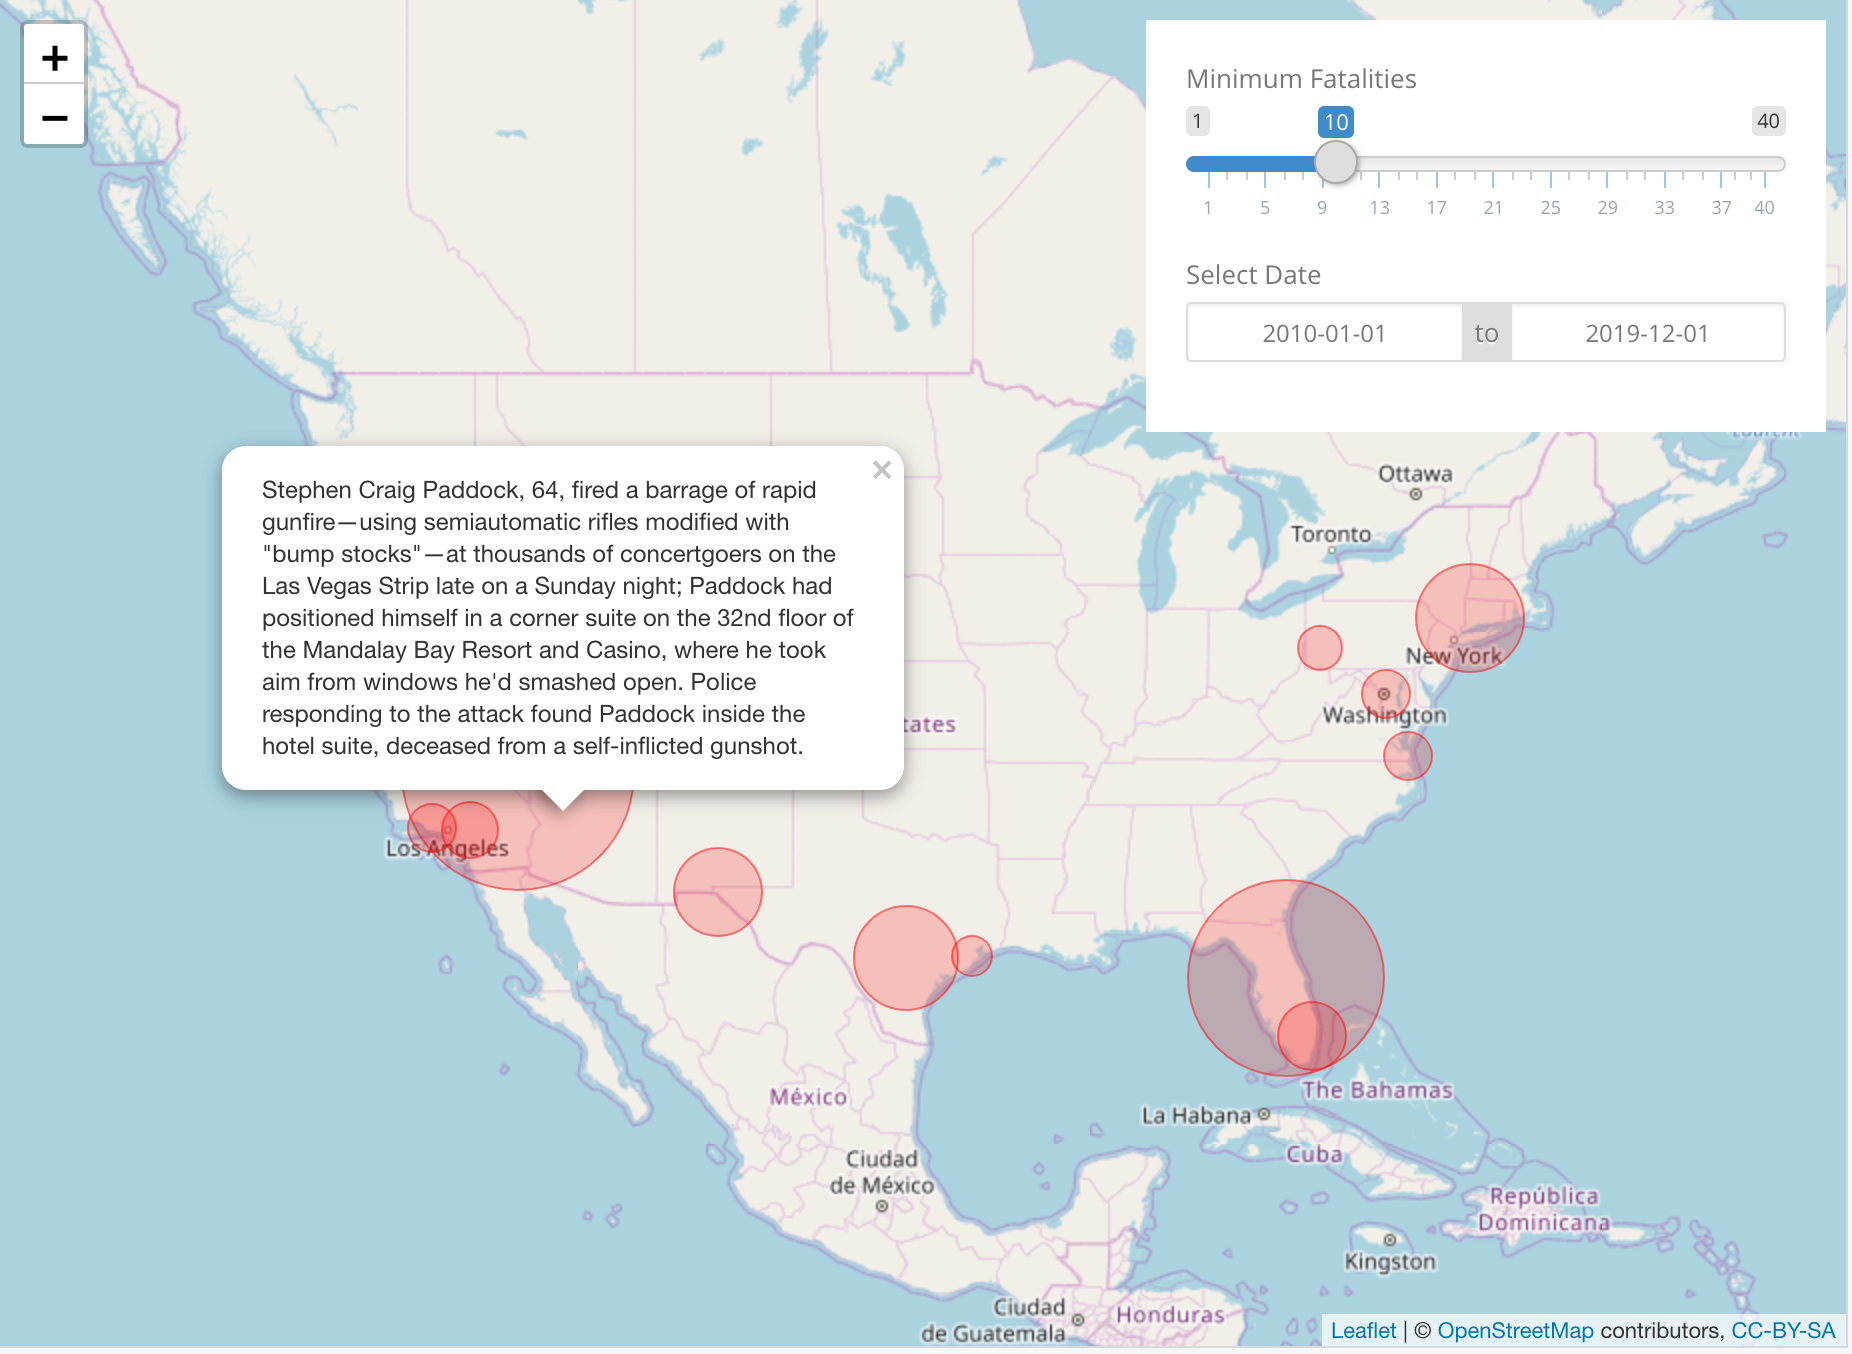
一个应用:每起大规模枪击案以红色圆点显示,点击圆点可查看详情

使用 R 构建 Shiny Web 应用

添加 UI

ui <- bootstrapPage(
  theme = shinythemes::shinytheme('simplex'),

leaflet::leafletOutput('map', width = '100%', height = '100%'),
absolutePanel(top = 10, right = 10, id = 'controls',
sliderInput('nb_fatalities', '最少死亡人数', 1, 40, 10),
dateRangeInput('date_range', '选择日期', "2010-01-01", "2019-12-01"),
)
, tags$style(type = "text/css", " html, body {width:100%;height:100%} #controls{background-color:white;padding:20px;} ")
)
使用 R 构建 Shiny Web 应用

添加输出:交互式地图

server <- function(input, output, session){

output$map <- leaflet::renderLeaflet({
leaflet() %>%
addTiles() %>%
setView( -98.58, 39.82, zoom = 5)
})
}
使用 R 构建 Shiny Web 应用

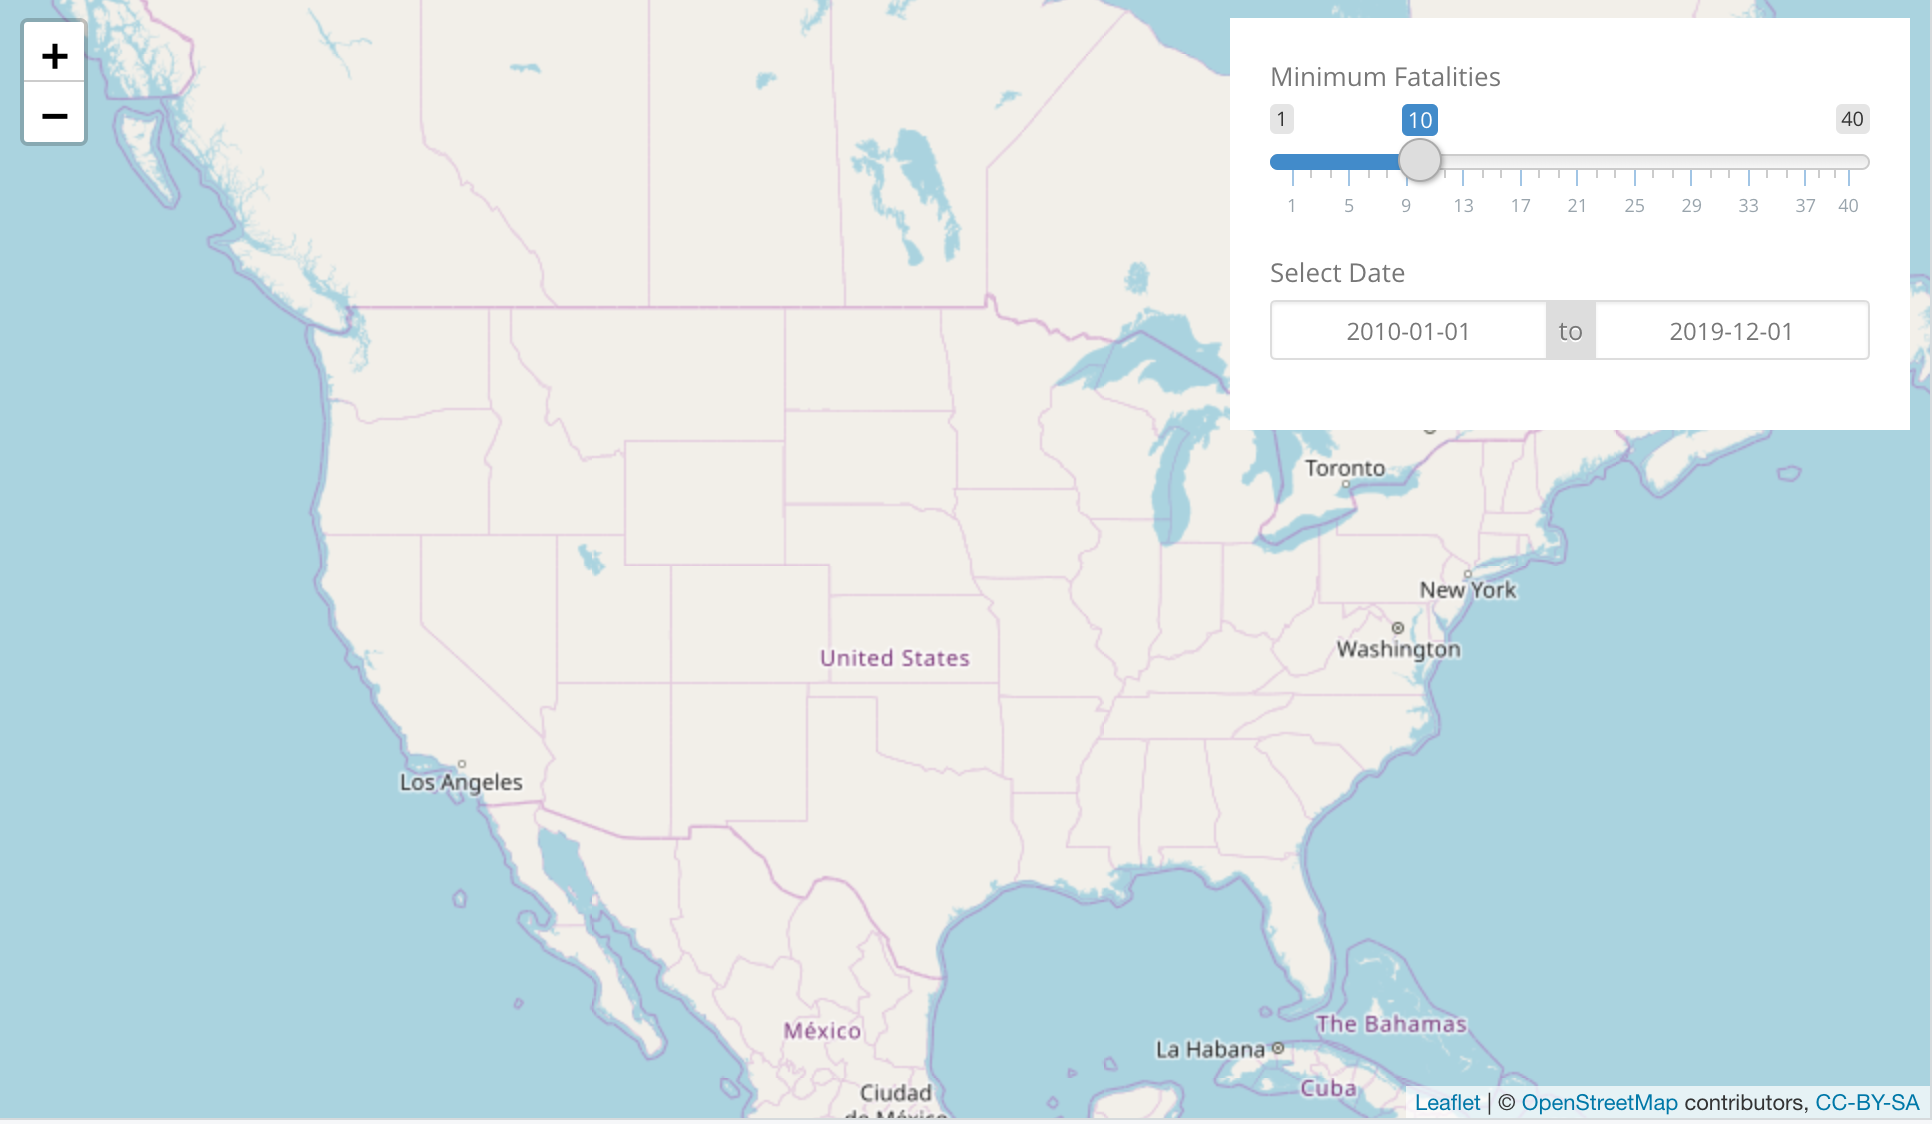
一个应用:带有美国交互式地图及日期范围与死亡人数控件

使用 R 构建 Shiny Web 应用

添加响应式表达式

rval_mass_shootings <- reactive({

mass_shootings %>%
filter(
date >= input$date_range[1],
date <= input$date_range[2],
fatalities >= input$nb_fatalities
)
})
使用 R 构建 Shiny Web 应用

更新输出:交互式地图

output$map <- leaflet::renderLeaflet({

rval_mass_shootings() %>%
leaflet() %>% addTiles() %>% setView( -98.58, 39.82, zoom = 5) %>%
addCircleMarkers(
popup = ~ summary,
radius = ~ fatalities,
fillColor = 'red', color = 'red', weight = 1
)
})
使用 R 构建 Shiny Web 应用

一个应用:每起大规模枪击案以红色圆点显示,点击圆点可查看详情

使用 R 构建 Shiny Web 应用

更新应用:添加操作按钮与模态框

ui <- bootstrapPage(
  theme = shinythemes::shinytheme('simplex'),
  leaflet::leafletOutput('map', width = '100%', height = '100%'),
  absolutePanel(top = 10, right = 10, id = 'controls',
    sliderInput('nb_fatalities', '最少死亡人数', 1, 40, 10),
    dateRangeInput('date_range', '选择日期', "2010-01-01", "2019-12-01"),

actionButton('show_about', '关于')
) )
server <- function(input, output, session){

observeEvent(input$show_about, {
showModal(modalDialog(text_about, title = '关于'))
})
}
使用 R 构建 Shiny Web 应用

一个应用:每起大规模枪击案以红色圆点显示,点击圆点可查看详情

使用 R 构建 Shiny Web 应用

开始练习!

使用 R 构建 Shiny Web 应用

Preparing Video For Download...