Python 投资组合分析入门
Charlotte Werger
Data Scientist

$$

$$
$$


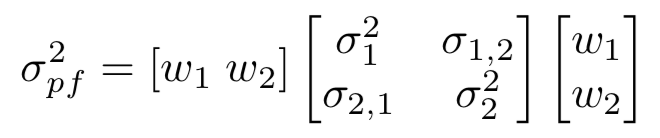
用文字描述,在 Python 中需计算:
组合方差 = 权重转置 ×(协方差矩阵 × 权重)
price_data.head(2)
ticker AAPL FB GE GM WMT
date
2018-03-21 171.270 169.39 13.88 37.58 88.18
2018-03-22 168.845 164.89 13.35 36.35 87.14
# Calculate daily returns from prices
daily_returns = df.pct_change()
# Construct a covariance matrix for the daily returns data
cov_matrix_d = daily_returns.cov()
# Construct a covariance matrix from the daily_returns
cov_matrix_d = (daily_returns.cov())*250
print (cov_matrix_d)
AAPL FB GE GM WMT
AAPL 0.053569 0.026822 0.013466 0.018119 0.010798
FB 0.026822 0.062351 0.015298 0.017250 0.008765
GE 0.013466 0.015298 0.045987 0.021315 0.009513
GM 0.018119 0.017250 0.021315 0.058651 0.011894
WMT 0.010798 0.008765 0.009513 0.011894 0.041520
weights = np.array([0.2, 0.2, 0.2, 0.2, 0.2])
# Calculate the variance with the formula
port_variance = np.dot(weights.T, np.dot(cov_matrix_a, weights))
print (port_variance)
0.022742232726360567
# Just converting the variance float into a percentage
print(str(np.round(port_variance, 3) * 100) + '%')
2.3%
port_stddev = np.sqrt(np.dot(weights.T, np.dot(cov_matrix_a, weights)))
print(str(np.round(port_stddev, 3) * 100) + '%')
15.1%
Python 投资组合分析入门