R 中的可视化最佳实践
Nick Strayer
Instructor
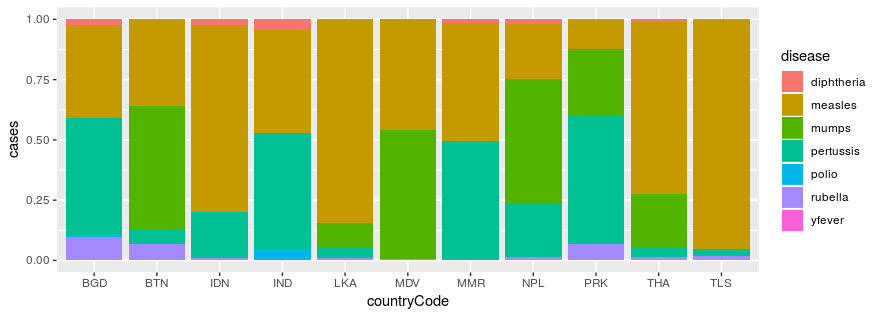
who_disease %>%
  filter(region == 'SEAR') %>%
  ggplot(aes(x = countryCode, y = cases, fill = disease)) +
    geom_col(position = 'fill')
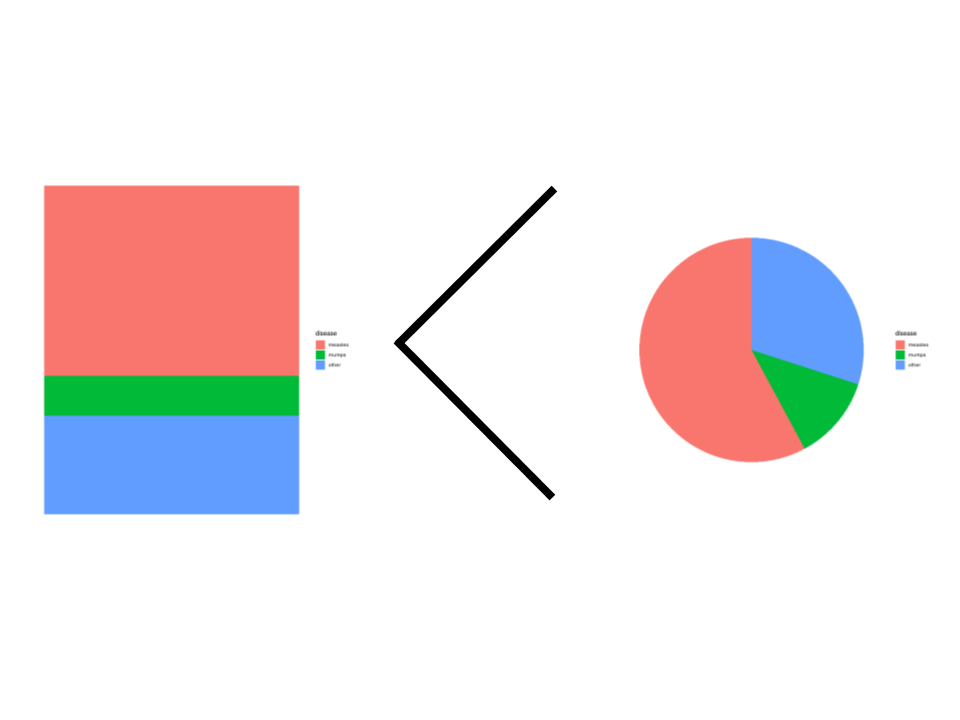
比例:
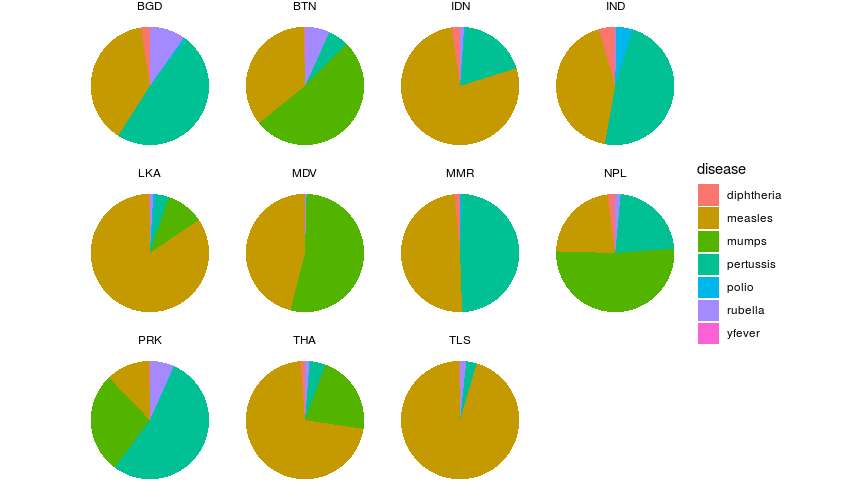
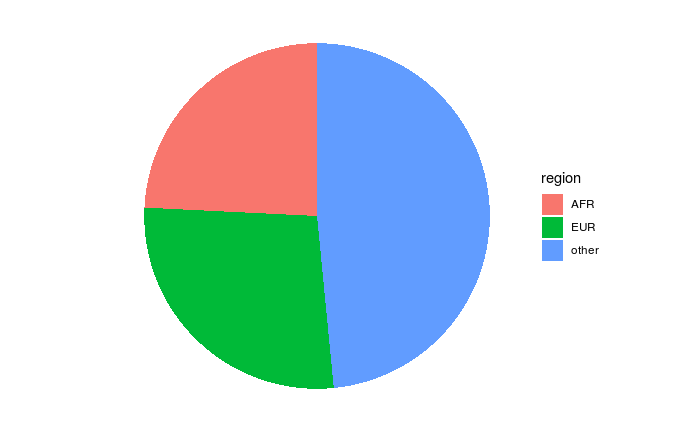
饼图:
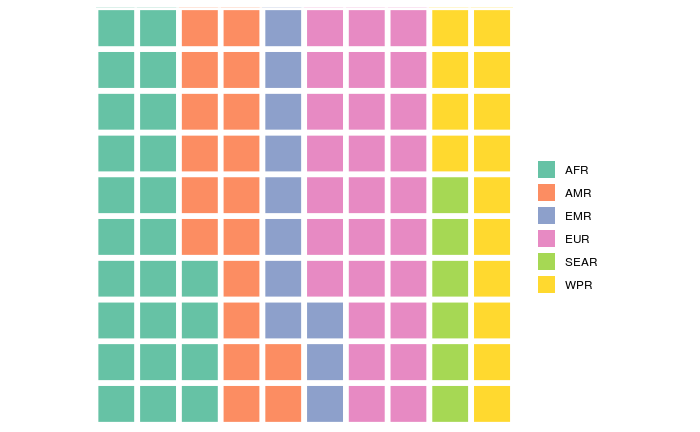
华夫图:
堆积条: