R 中的可视化最佳实践
Nick Strayer
Instructor
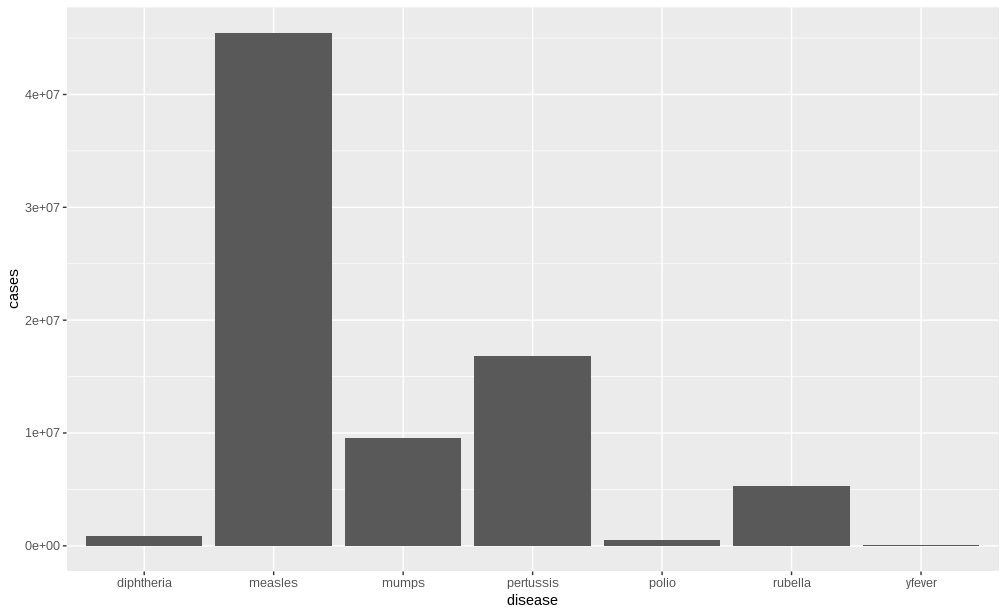
ggplot(who_disease) +
  geom_col(aes(x = disease, y = cases))
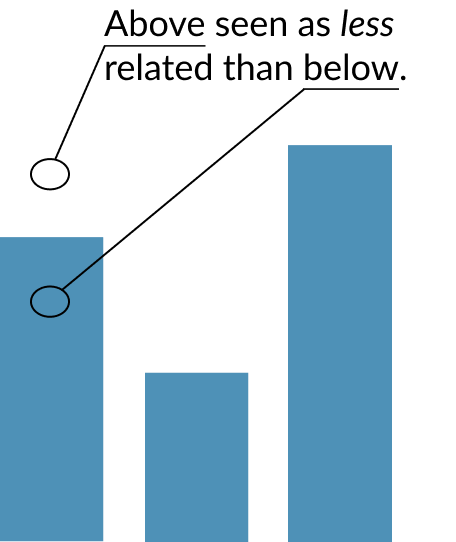
"……观众会认为柱内的点比与均值等距但在柱外的点更可能……"
- Scholl & Newman,2012