DESeq2 模型 - 对比

使用 R 中的 Bioconductor 进行 RNA-Seq 分析

Mary Piper

Bioinformatics Consultant and Trainer

DESeq2 工作流
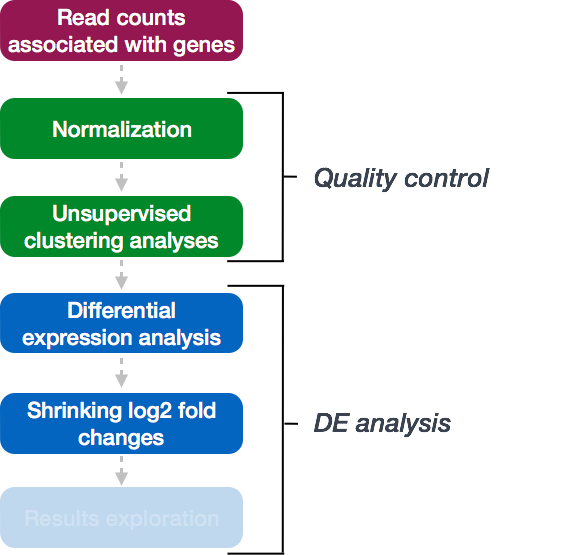
DESeq2 工作流 - LFC 收缩

使用 R 中的 Bioconductor 进行 RNA-Seq 分析

DESeq2 工作流

# 运行分析 
dds_wt <- DESeq(dds_wt)
using pre-existing size factors
estimating dispersions
gene-wise dispersion estimates
mean-dispersion relationship
final dispersion estimates
fitting model and testing
使用 R 中的 Bioconductor 进行 RNA-Seq 分析

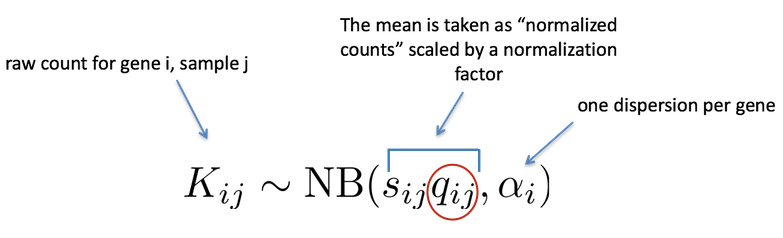
DESeq2 负二项模型

NB 模型

使用 R 中的 Bioconductor 进行 RNA-Seq 分析

DESeq2 负二项模型

NB 模型2

使用 R 中的 Bioconductor 进行 RNA-Seq 分析

DESeq2 对比

results(wt_dds, alpha = 0.05)
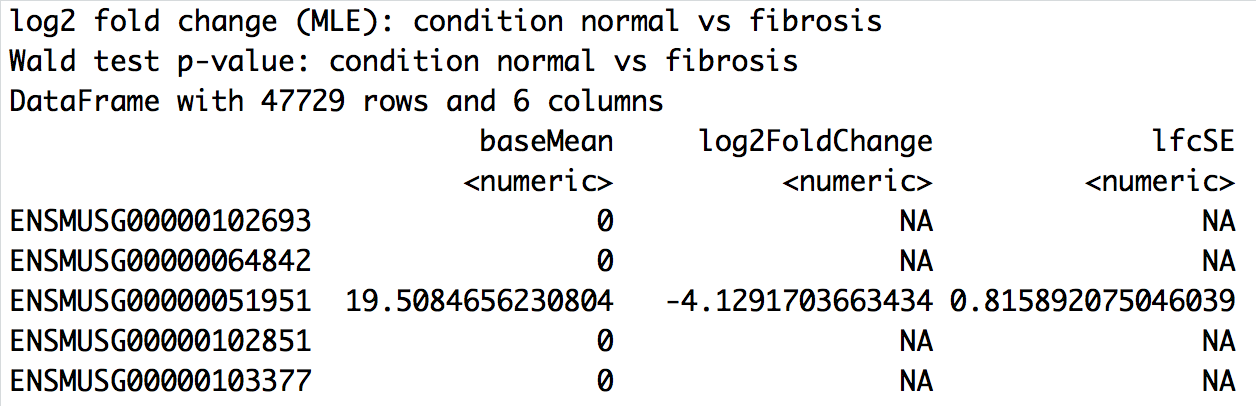
对比结果输出

使用 R 中的 Bioconductor 进行 RNA-Seq 分析

DESeq2 对比

语法如下:

results(dds, 
        contrast = c("condition_factor", "level_to_compare", 
        "base_level"), 
        alpha = 0.05)
wt_res <- results(dds_wt, 
            contrast = c("condition", "fibrosis", 
            "normal"), 
            alpha = 0.05)
使用 R 中的 Bioconductor 进行 RNA-Seq 分析

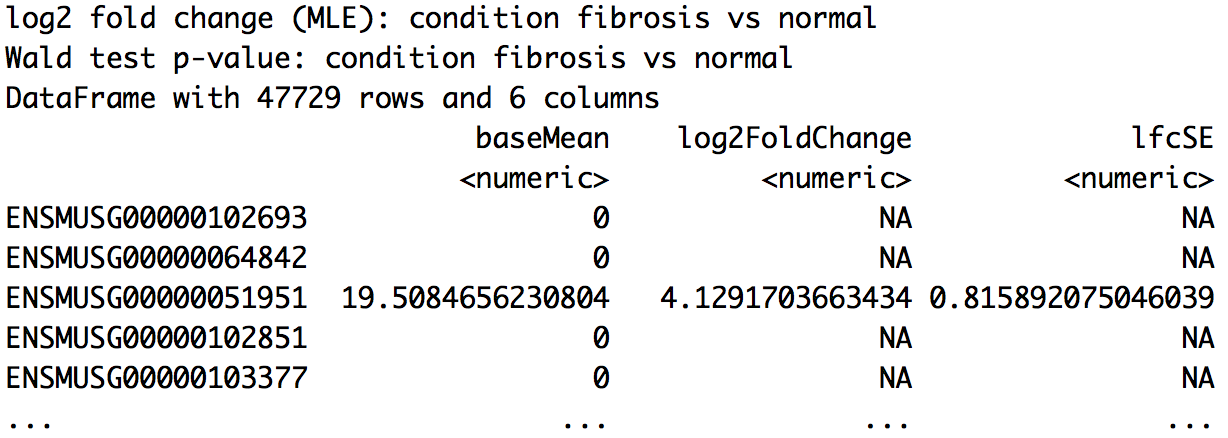
DESeq2 对比

wt_res

对比结果输出

使用 R 中的 Bioconductor 进行 RNA-Seq 分析

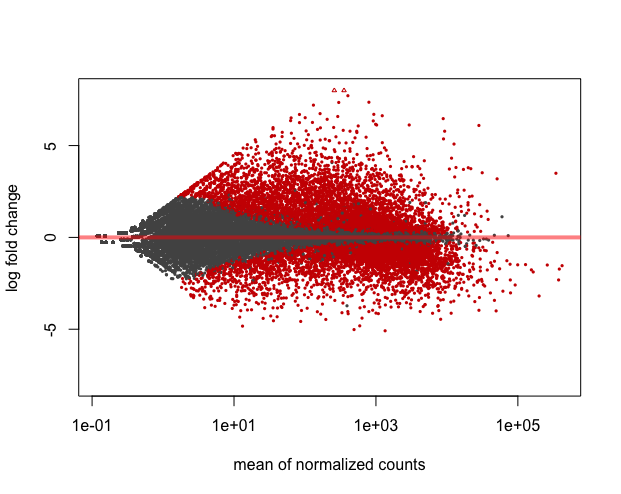
DESeq2 LFC 收缩

plotMA(wt_res, ylim=c(-8,8))
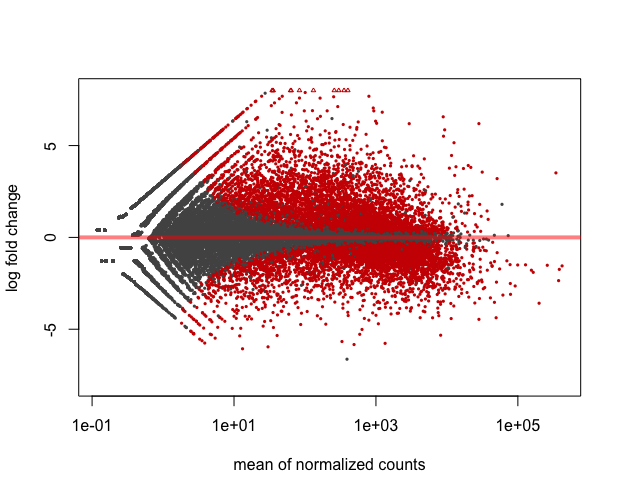
MA 图:未收缩倍数变化

使用 R 中的 Bioconductor 进行 RNA-Seq 分析

LFC 收缩

wt_res <- lfcShrink(dds_wt, 
            contrast=c("condition", "fibrosis", "normal"),
            res=wt_res)
plotMA(wt_res, ylim=c(-8,8))
使用 R 中的 Bioconductor 进行 RNA-Seq 分析

LFC 收缩

MA 图:已收缩倍数变化

使用 R 中的 Bioconductor 进行 RNA-Seq 分析

Ayo berlatih!

使用 R 中的 Bioconductor 进行 RNA-Seq 分析

Preparing Video For Download...