DESeq2 模型

使用 R 中的 Bioconductor 进行 RNA-Seq 分析

Mary Piper

Bioinformatics Consultant and Trainer

DESeq2 模型
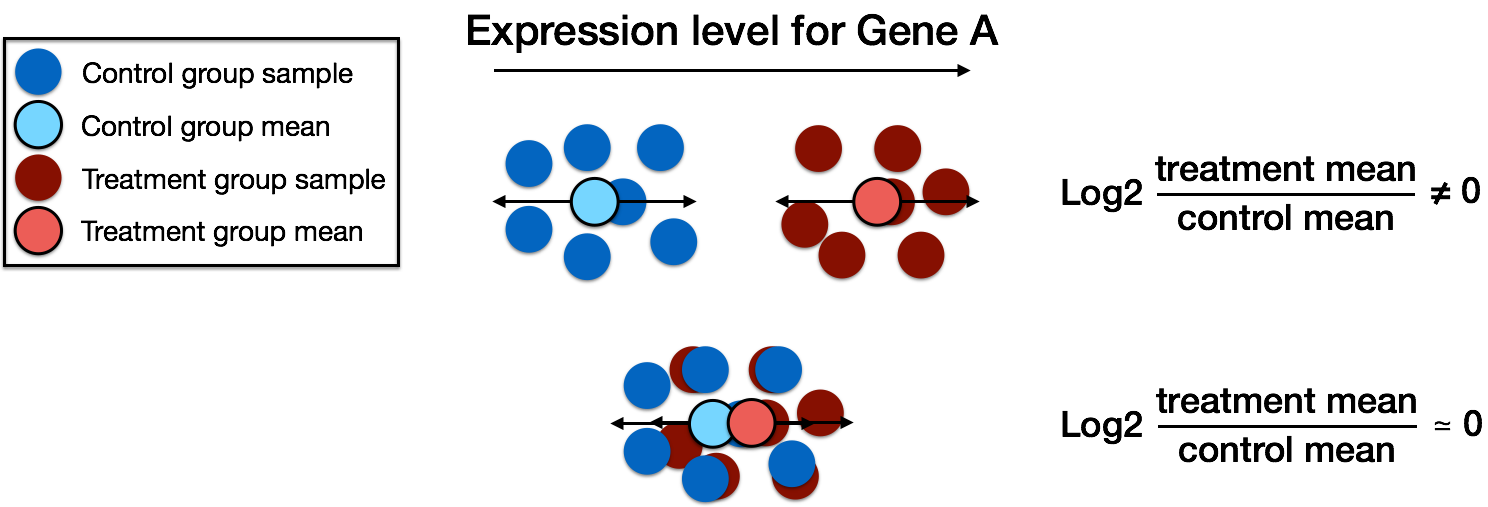
差异表达理论

使用 R 中的 Bioconductor 进行 RNA-Seq 分析

DESeq2 模型 - 均值-方差关系

# apply() 语法
apply(data, rows/columns, function_to_apply)
# 计算每个基因(每行)的均值
mean_counts <- apply(wt_rawcounts[, 1:3], 1, mean)
# 计算每个基因(每行)的方差
variance_counts <- apply(wt_rawcounts[, 1:3], 1, var)
使用 R 中的 Bioconductor 进行 RNA-Seq 分析

DESeq2 模型 - 离散度

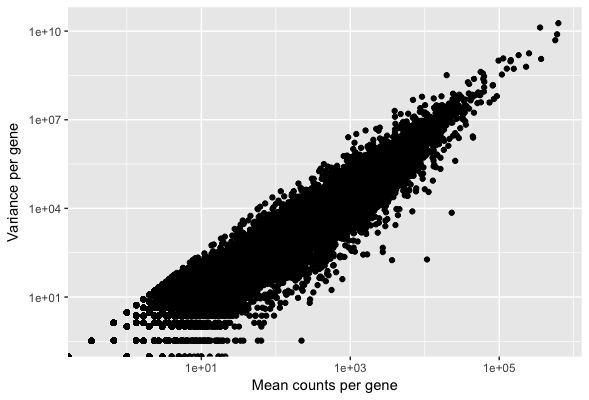
绘制均值与方差的关系:

# 为每个基因创建含均值与方差的数据框
df <- data.frame(mean_counts, variance_counts)
ggplot(df) +
        geom_point(aes(x=mean_counts, y=variance_counts)) + 
        scale_y_log10() +
        scale_x_log10() +
        xlab("Mean counts per gene") +
        ylab("Variance per gene")
使用 R 中的 Bioconductor 进行 RNA-Seq 分析

DESeq2 模型 - 离散度

均值-方差关系

使用 R 中的 Bioconductor 进行 RNA-Seq 分析

DESeq2 模型 - 离散度

$Var$: 方差

$\mu$: 均值

$\alpha$: 离散度

离散度公式: $Var = \mu + \alpha * \mu^{2}$

均值、方差与离散度的关系:

$$\uparrow 方差 \Rightarrow \uparrow 离散度$$

$$\uparrow 均值 \Rightarrow \downarrow 离散度$$

使用 R 中的 Bioconductor 进行 RNA-Seq 分析

DESeq2 模型 - 离散度

# 绘制离散度估计
plotDispEsts(dds_wt)
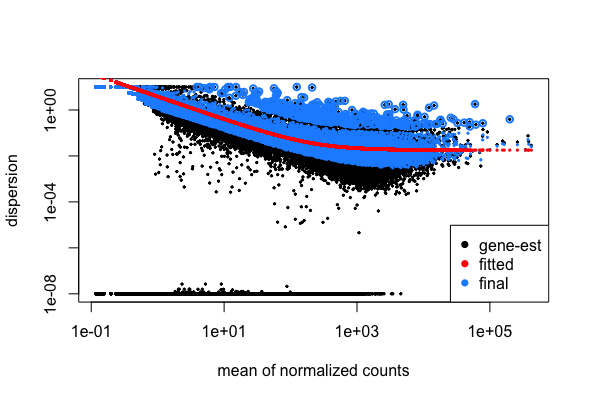
离散度图

使用 R 中的 Bioconductor 进行 RNA-Seq 分析

DESeq2 模型 - 离散度

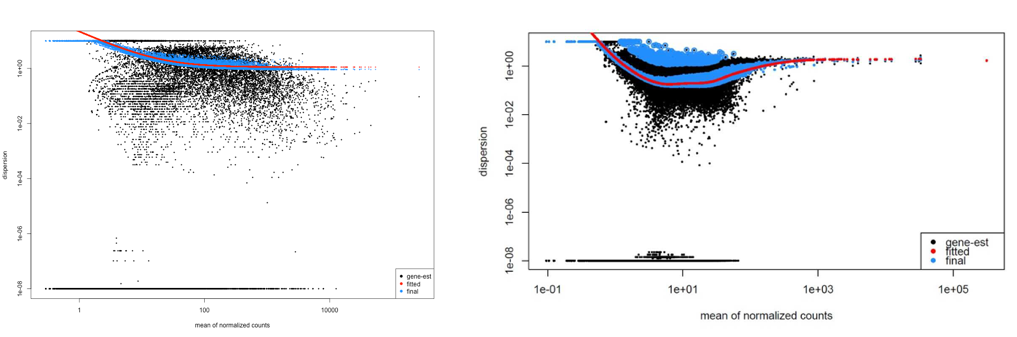
不佳的离散度图

使用 R 中的 Bioconductor 进行 RNA-Seq 分析

让我们来练习!

使用 R 中的 Bioconductor 进行 RNA-Seq 分析

Preparing Video For Download...