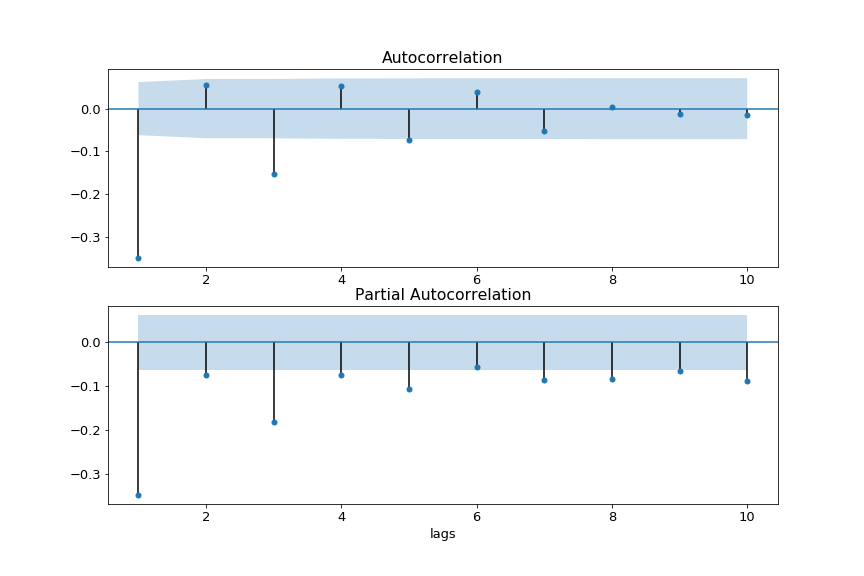
ACF 与 PACF 简介
Python 中的 ARIMA 模型

James Fulton
Climate informatics researcher
动机
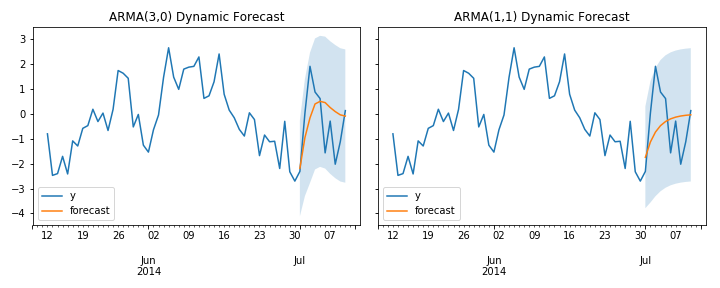
什么是 ACF
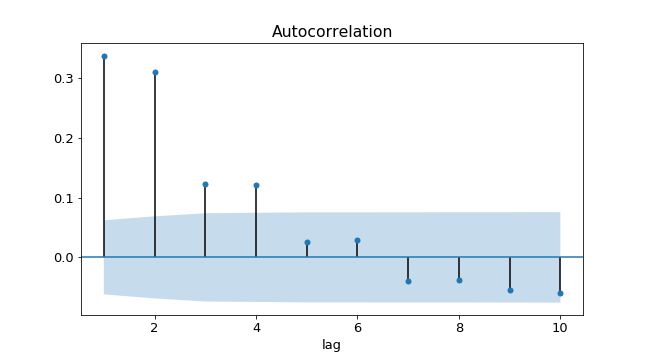
什么是 PACF
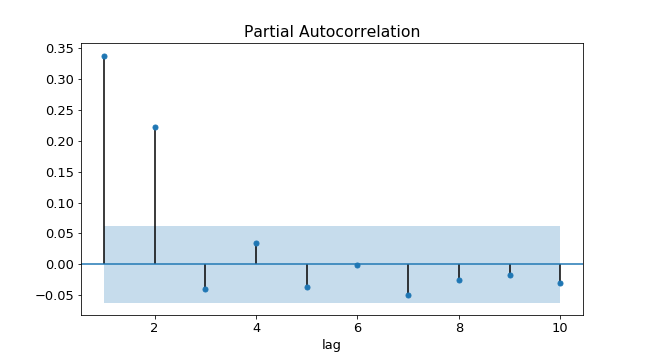
用 ACF 和 PACF 选模型阶数
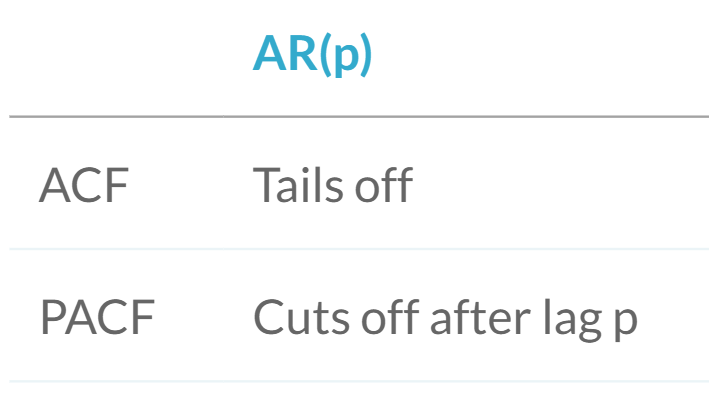
- AR(2) 模型 $\rightarrow$
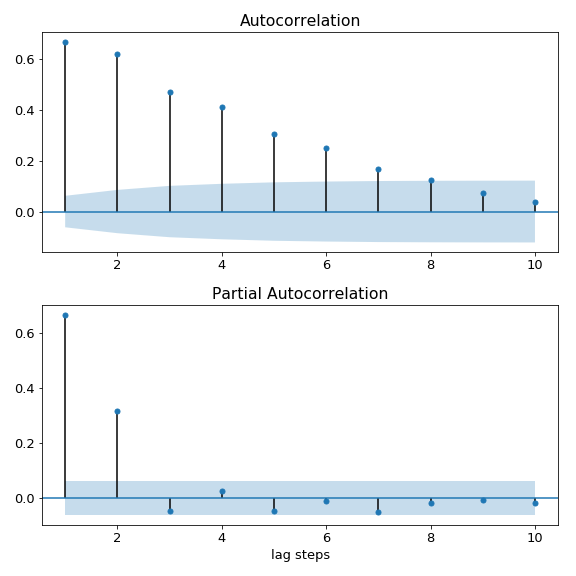
用 ACF 和 PACF 选模型阶数
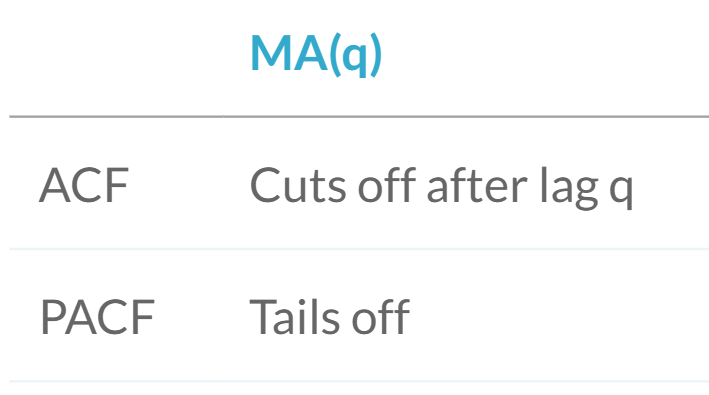
- MA(2) 模型 $\rightarrow$
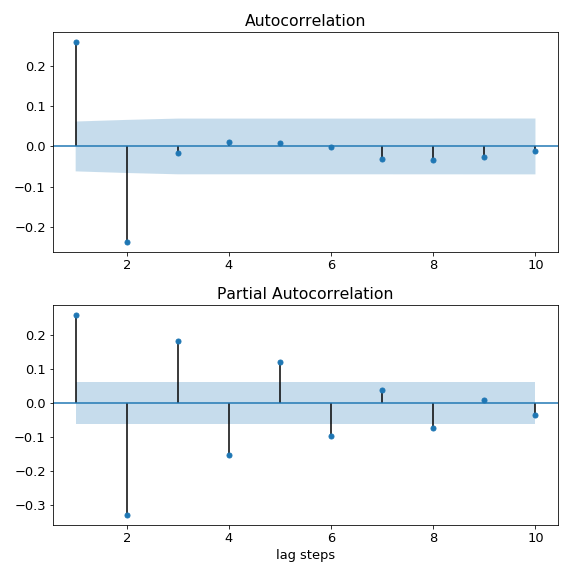
用 ACF 和 PACF 选模型阶数
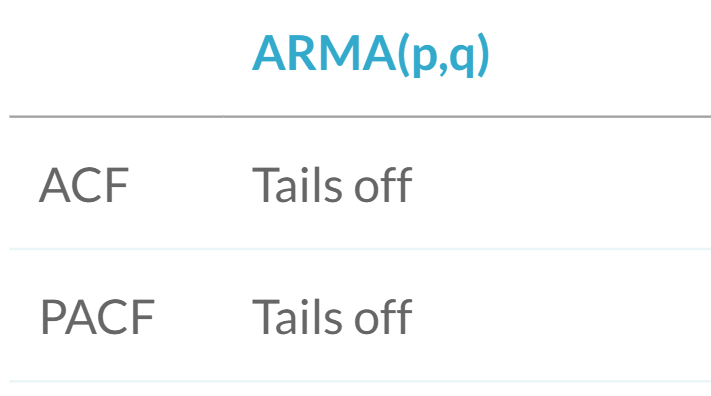
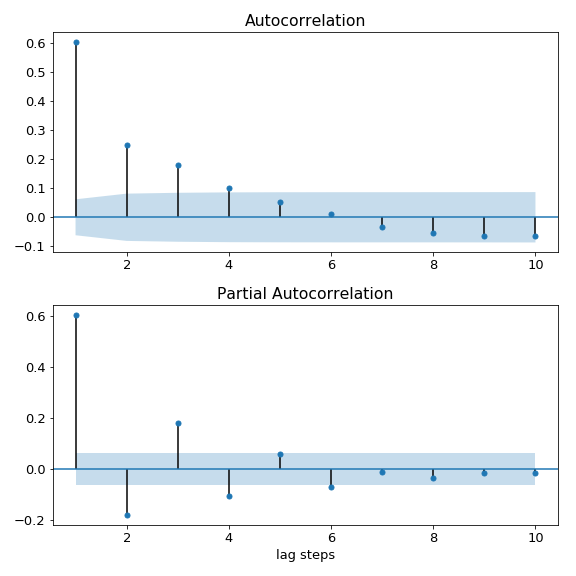
用 ACF 和 PACF 选模型阶数
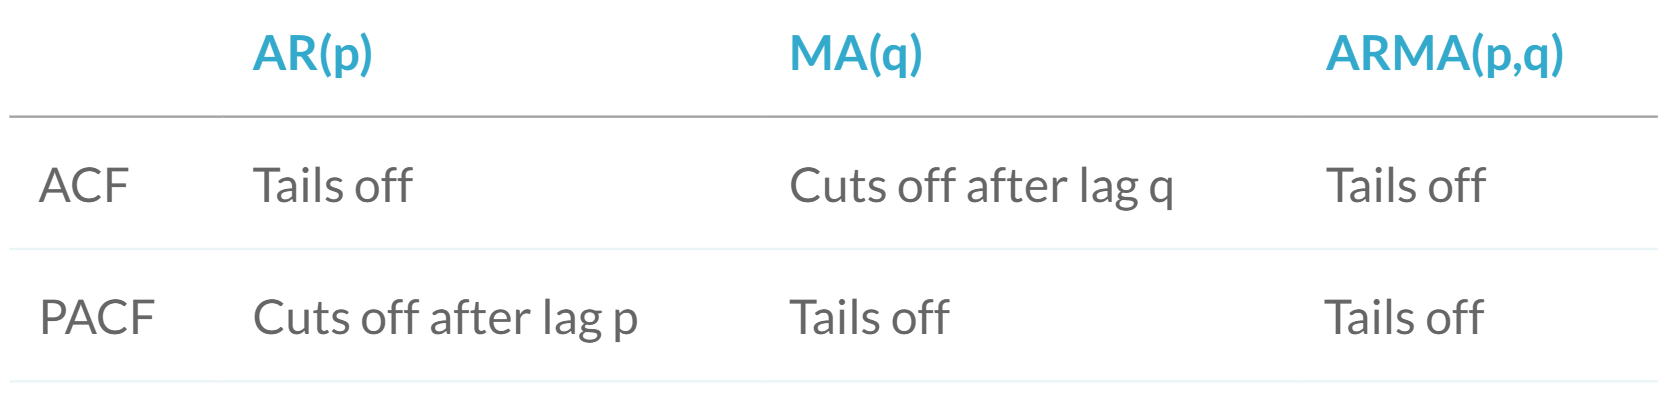
Python 实现
过度/欠差分与 ACF、PACF
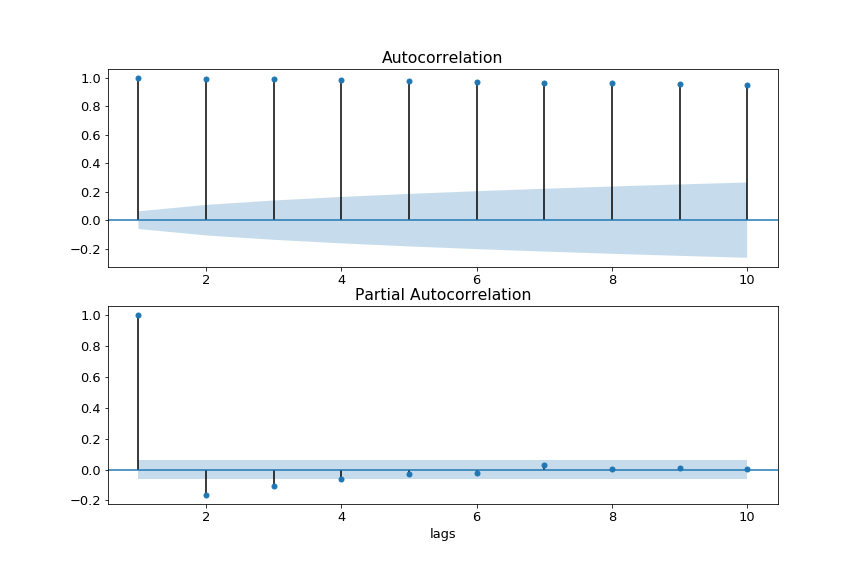
过度/欠差分与 ACF、PACF