用于异常检测的时间序列分解

Python 中的异常检测

Bekhruz (Bex) Tuychiev

Kaggle Master, Data Science Content Creator

季节性
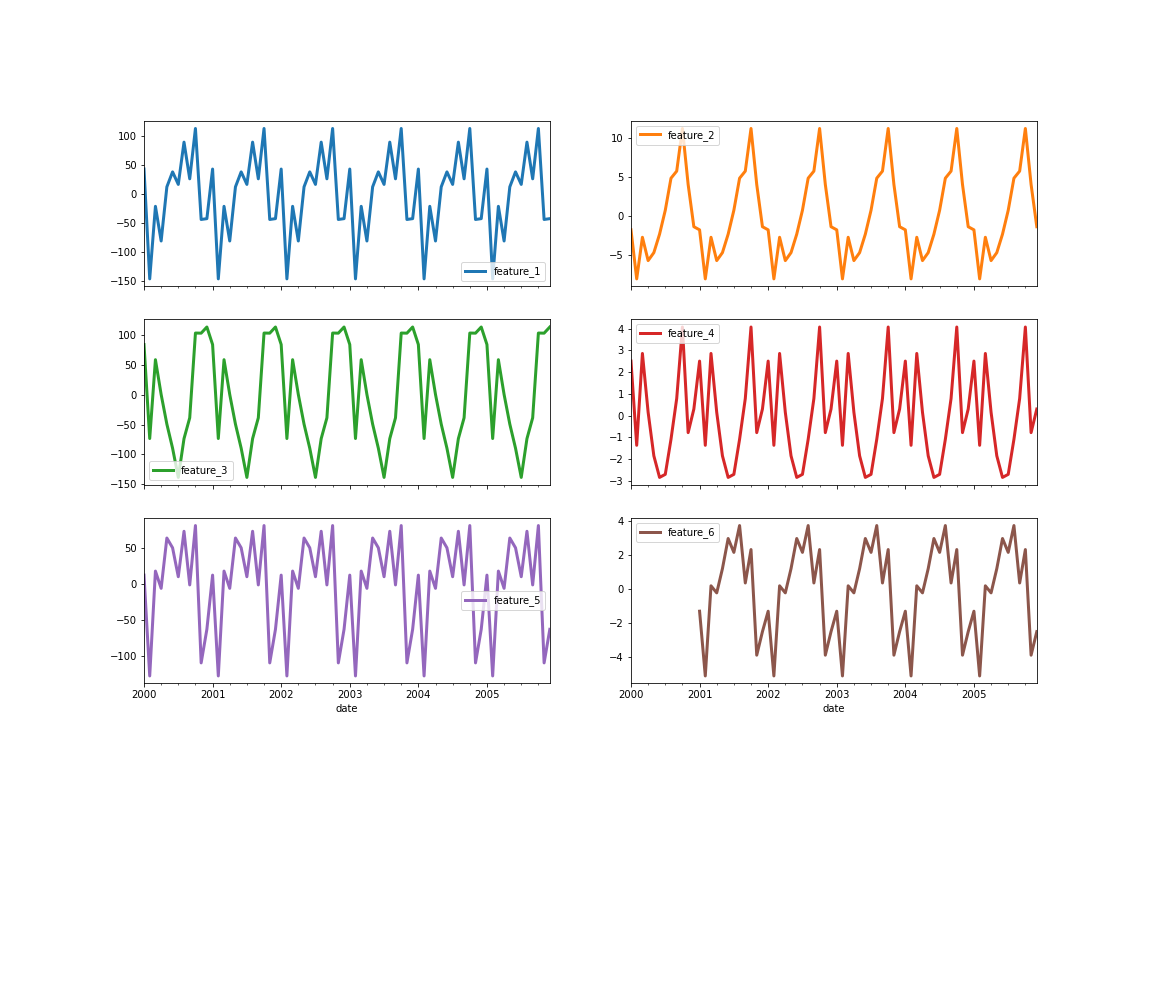
  • 时间序列中的重复模式
  • 固定频率:
    • 每小时
    • 每天
    • 每周
    • 每月等
  • 示例:
    • 每日气温
    • 冰淇淋销量
Python 中的异常检测

季节性

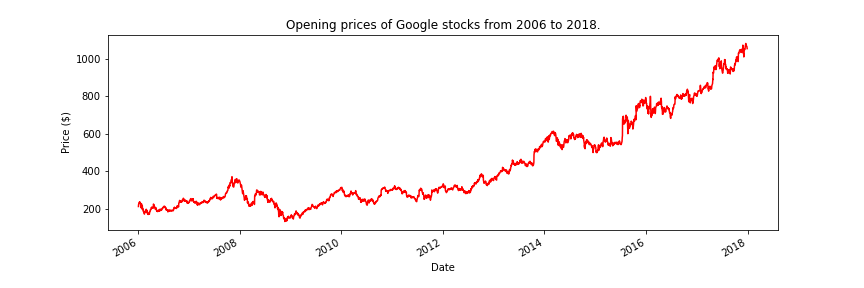
谷歌股票开盘价的折线图。

Python 中的异常检测

seasonal_decompose

from statsmodels.tsa.seasonal import seasonal_decompose

results = seasonal_decompose(google['Open'], period=365)

print(results)
<statsmodels.tsa.seasonal.DecomposeResult object at 0x7f0a67fac820>
Python 中的异常检测

绘制季节性

results.seasonal.plot(color="red", figsize=(12, 4))
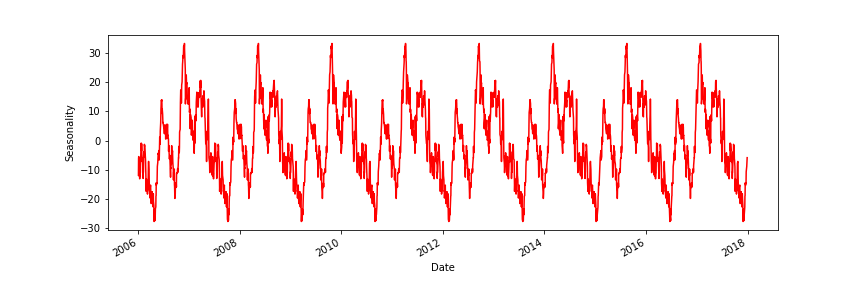
谷歌股票开盘价的季节性图

Python 中的异常检测

季节性示例

时间序列季节性示例。

Python 中的异常检测

股票初始图

谷歌股票开盘价的初始折线图

Python 中的异常检测

趋势

results.trend.plot(color="red", figsize=(12, 4))

Python 中的异常检测

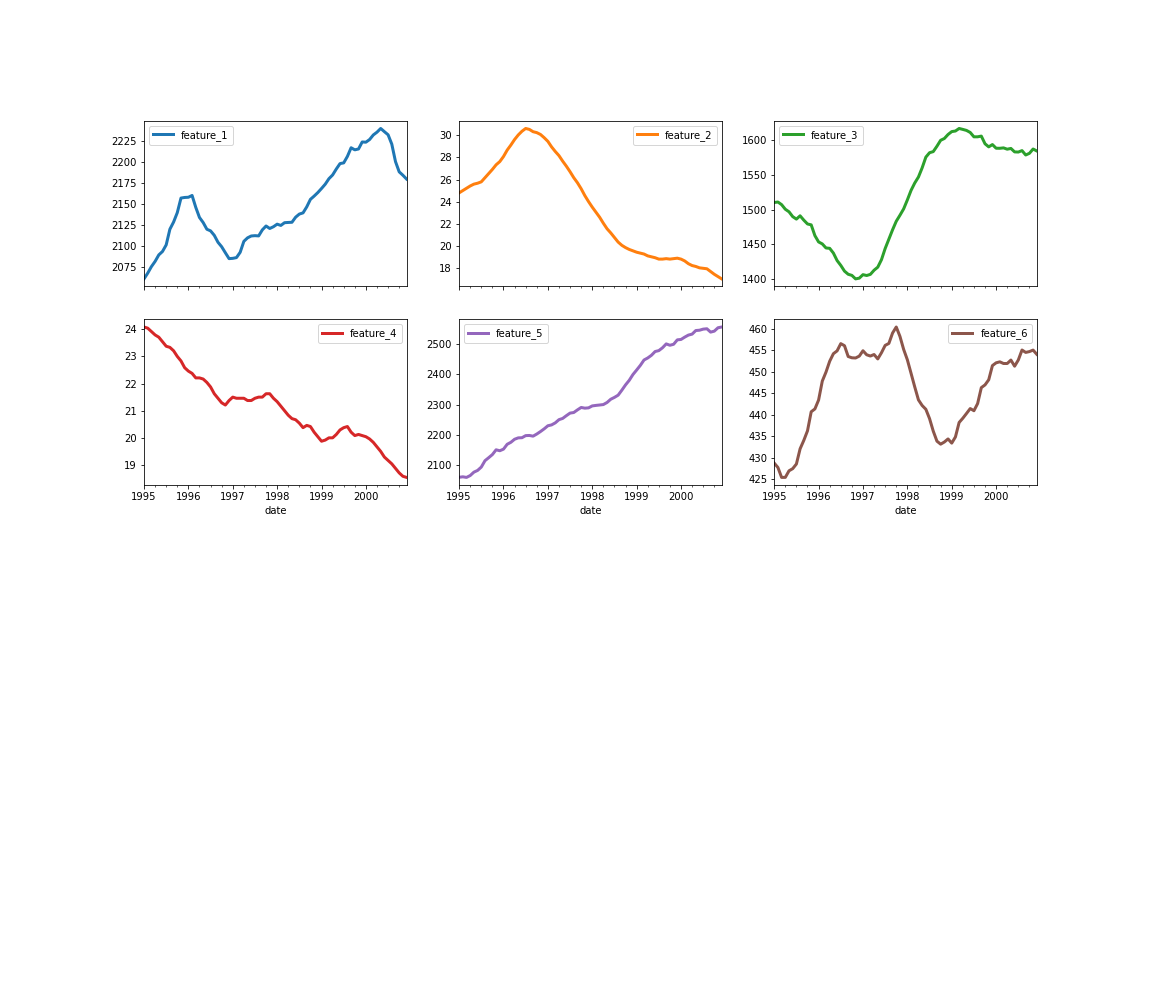
趋势示例

时间序列趋势示例。

Python 中的异常检测

残差

results.resid.plot(color="red", figsize=(12, 4))
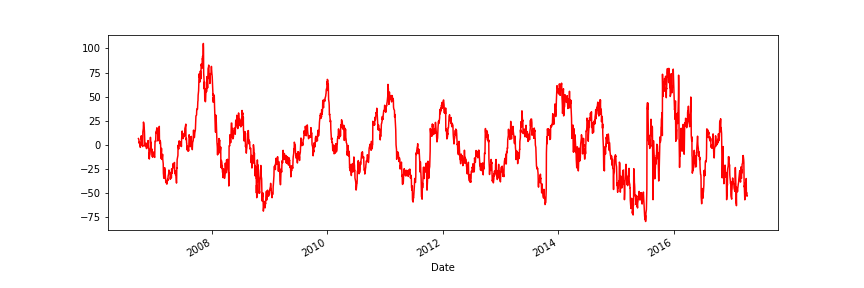
谷歌股票开盘价残差图。

Python 中的异常检测

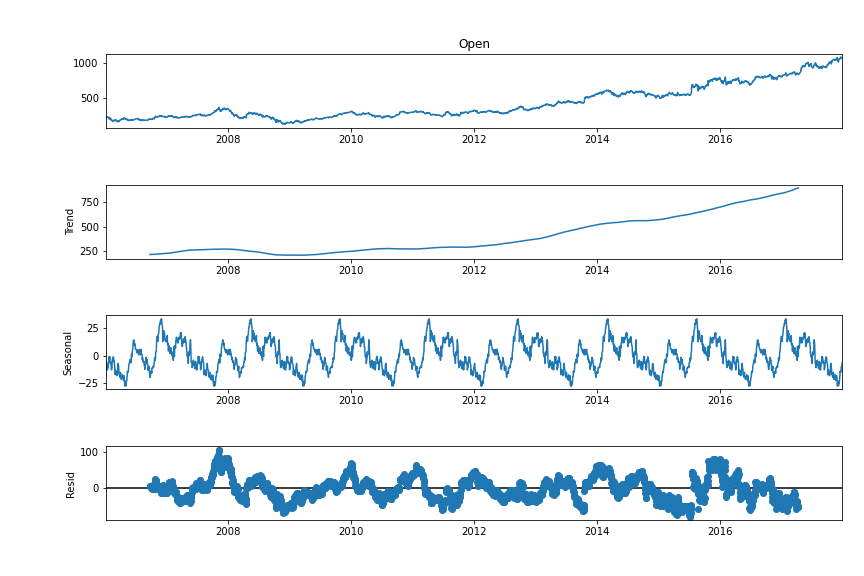
分解

figure = results.plot()

figure.set_figwidth(12)
figure.set_figheight(8)

时间序列的三个组成部分可视化。

Python 中的异常检测

拟合分类器

# Extract and reshape residuals
results = seasonal_decompose(google['Volume'], period=365)
residuals = results.resid
residuals = residuals.values.reshape(-1, 1)


# Fit MAD mad = MAD().fit(residuals)
# Find the outliers is_outlier = mad.labels_ == 1 outliers = google[is_outlier] print(len(outliers))
81
Python 中的异常检测

Vamos praticar!

Python 中的异常检测

Preparing Video For Download...