对异常值稳健的特征缩放

Python 中的异常检测

Bekhruz (Bex) Tuychiev

Kaggle Master, Data Science Content Creator

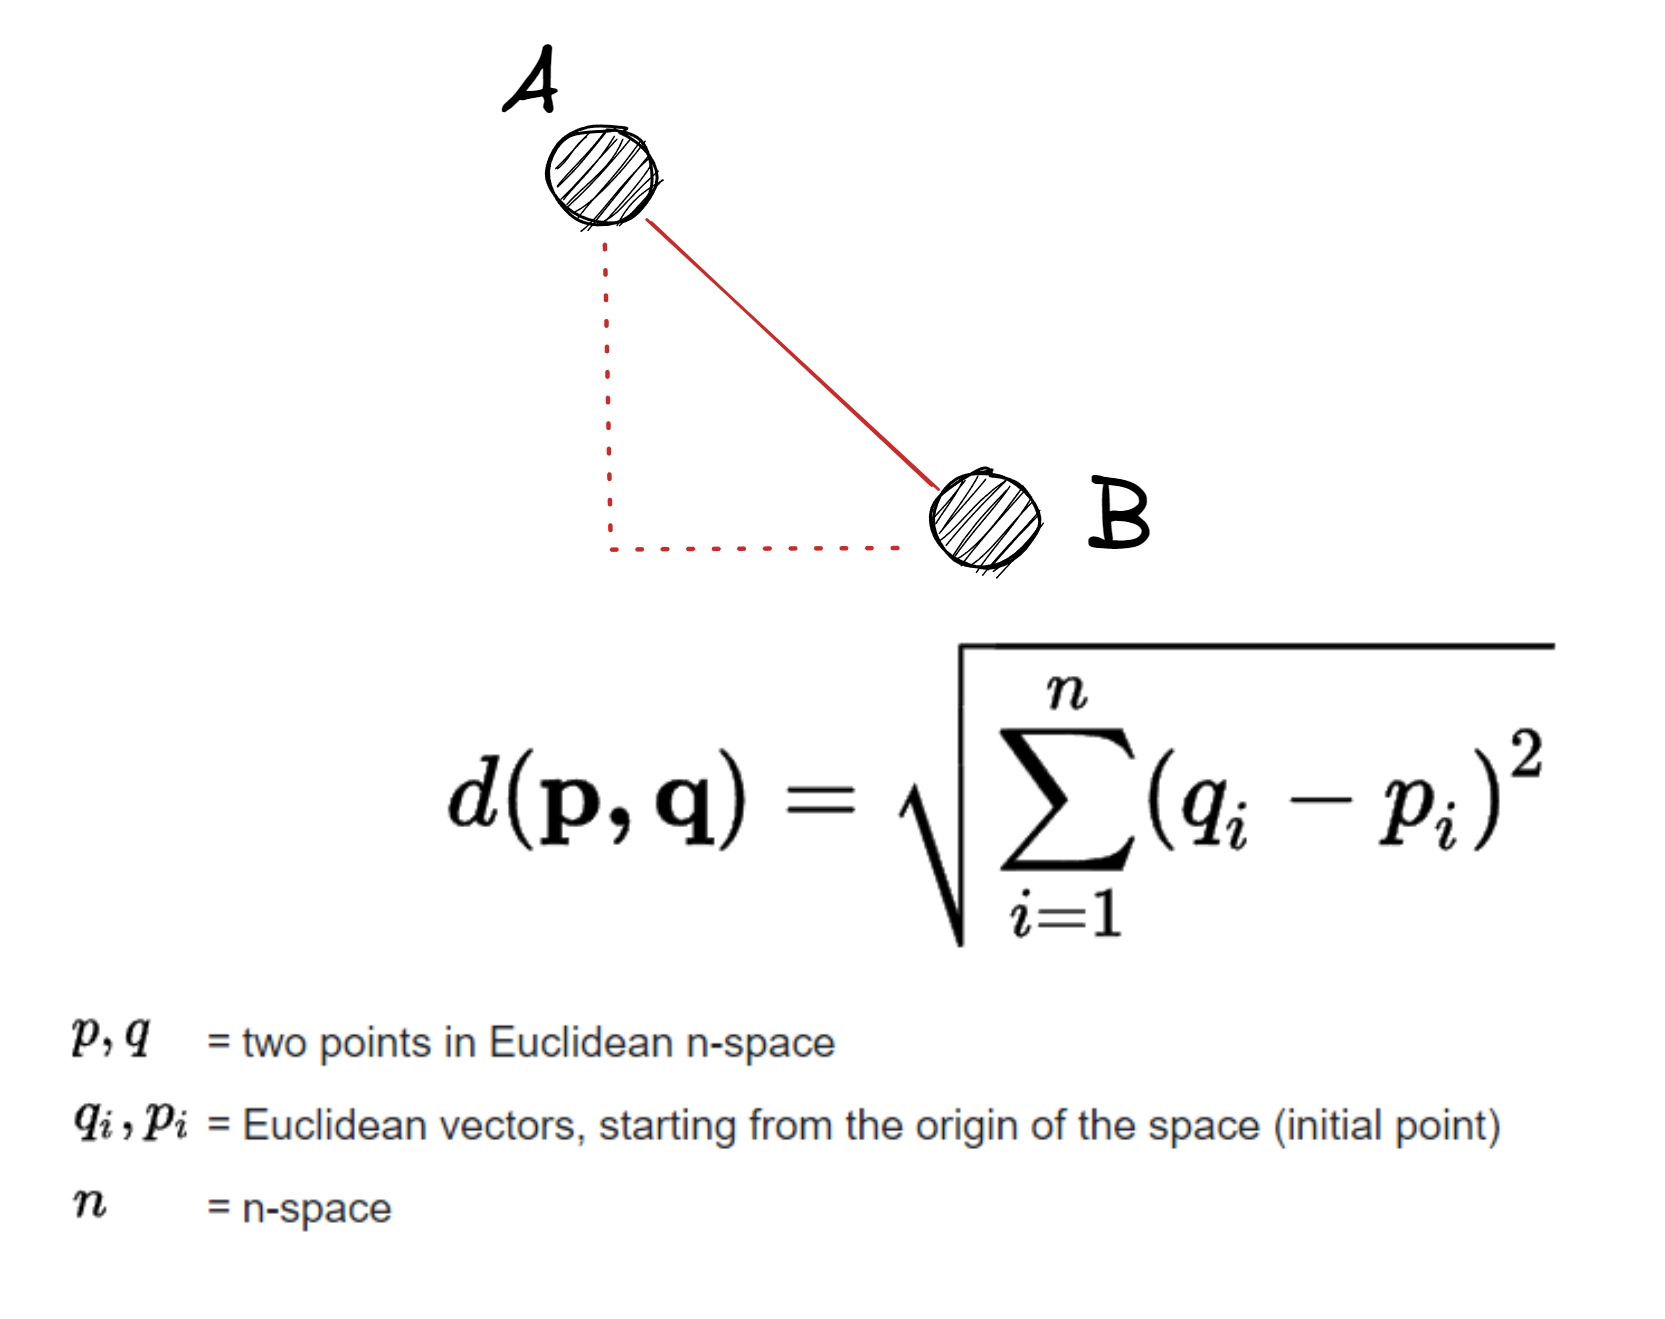
欧氏距离
A = np.array([9, 1, 6])
B = np.array([25, 44, 85])


diffs = (B - A) ** 2
dist_AB = np.sqrt(np.sum(diffs)) print(dist_AB)
91.35644476444998

欧氏距离的计算公式及其示意图。

Python 中的异常检测

SciPy 中的欧氏距离

from scipy.spatial.distance import \
euclidean

dist_AB = euclidean(A, B)
dist_AB
91.35644476444998

欧氏距离的计算公式及其示意图。

Python 中的异常检测

标准化

  • 减去均值并除以标准差
  • 结果:均值为 0,标准差为 1
Python 中的异常检测

StandardScaler

from sklearn.preprocessing import StandardScaler

ss = StandardScaler()

# 提取特征和目标 X = males.drop("weightkg", axis=1) y = males[['weightkg']]
# 拟合 ss.fit(X)
Python 中的异常检测

转换

X_transformed = ss.transform(X)

X_transformed[:5]
array([[-1.05174523],
       [-0.29289108],
       [ 1.3446363 ],
       [-1.21654894],
       [0.056451235]])
Python 中的异常检测

fit_transform

ss = StandardScaler()

X_transformed = ss.fit_transform(X)
Python 中的异常检测

QuantileTransformer

from sklearn.preprocessing import QuantileTransformer


# 初始化 qt = QuantileTransformer() X = males.drop("weightkg", axis=1) y = males[['weightkg']]
X_transformed = qt.fit_transform(X) X_transformed.shape
(4082, 94)
Python 中的异常检测

保留列名

qt = QuantileTransformer()

X.loc[:, :] = qt.fit_transform(X)

X.head()

Ansur 男性体测数据集的特征矩阵经转换后的前五行。

Python 中的异常检测

均匀分布直方图

plt.hist(X['footlength'], color='red')

plt.xlabel("Foot length")
plt.title("Histogram of foot lengths")

plt.show()

脚长列的直方图,呈均匀分布

Python 中的异常检测

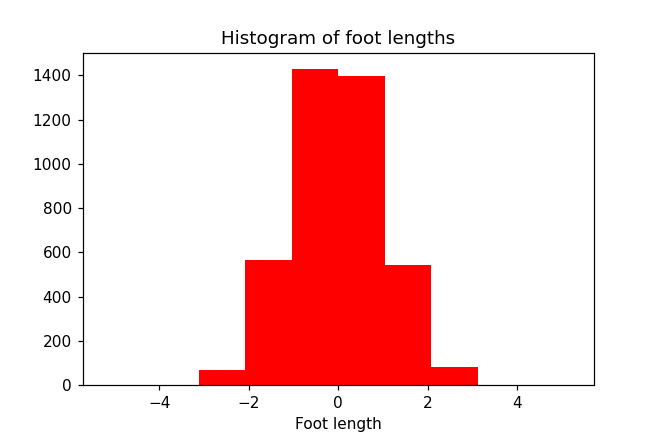
正态分布直方图

qt = QuantileTransformer(
  output_distribution='normal')

# 重建被覆盖的特征矩阵
X = males.drop("weightkg", axis=1)
X.loc[:, :] = qt.fit_transform(X)

plt.hist(X['footlength'], color='r')
plt.xlabel("Foot length")
plt.title("Histogram of foot lengths")

plt.show()

脚长列的直方图,呈近似正态分布

Python 中的异常检测

Vamos praticar!

Python 中的异常检测

Preparing Video For Download...