Python 中的金融交易
Chelsea Yang
Data Science Instructor
# Calculate ADX
stock_data['ADX'] = talib.ADX(stock_data['High'], stock_data['Low'], stock_data['Close'],
                              timeperiod=14)

# Print the last five rows
print(stock_data.tail())
# Calculate ADX stock_data['ADX'] = talib.ADX(stock_data['High'], stock_data['Low'], stock_data['Close'], timeperiod=14)
# Print the last five rows print(stock_data.tail())
             Open   High    Low  Close   ADX
Date
2020-11-24 540.40 559.99 526.20 555.38 21.16
2020-11-25 550.06 574.00 545.37 574.00 23.92
2020-11-27 581.16 598.78 578.45 585.76 26.82
2020-11-30 602.21 607.80 554.51 567.60 28.25
2020-12-01 597.59 597.85 572.05 584.76 29.58
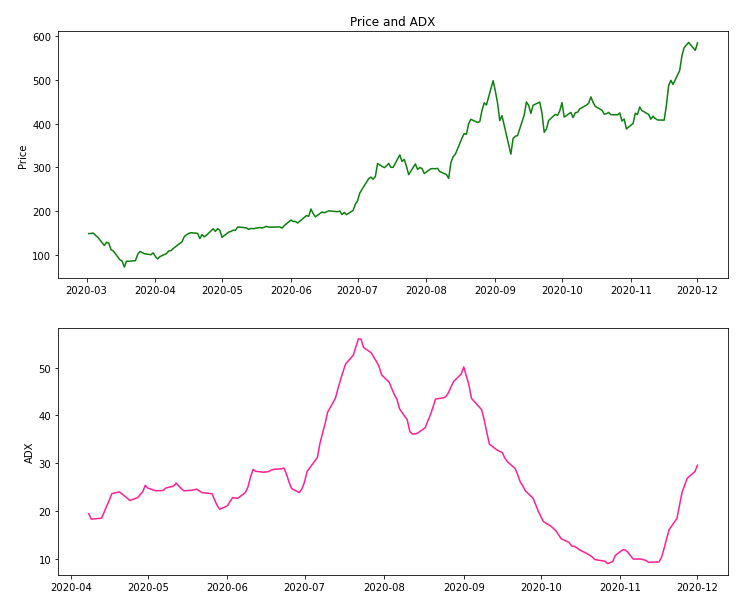
import matplotlib.pyplot as plt

# Create subplots
fig, (ax1, ax2) = plt.subplots(2)


# Plot ADX with the price
ax1.set_ylabel('Price')
ax1.plot(stock_data['Close'])
ax2.set_ylabel('ADX')
ax2.plot(stock_data['ADX'])

ax1.set_title('Price and ADX')
plt.show()
import matplotlib.pyplot as plt # Create subplots fig, (ax1, ax2) = plt.subplots(2)
# Plot ADX with the price ax1.set_ylabel('Price') ax1.plot(stock_data['Close']) ax2.set_ylabel('ADX') ax2.plot(stock_data['ADX']) ax1.set_title('Price and ADX') plt.show()