生成连续型随机变量

Python 中的蒙特卡洛模拟

Izzy Weber

Curriculum Manager, DataCamp

正态分布

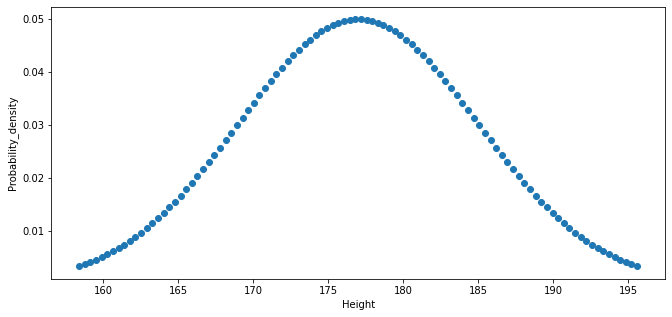
钟形,中心在均值(loc);宽度由标准差(scale)决定

美国成年男性身高服从正态分布: 正态分布的理论概率密度函数
Python 中的蒙特卡洛模拟

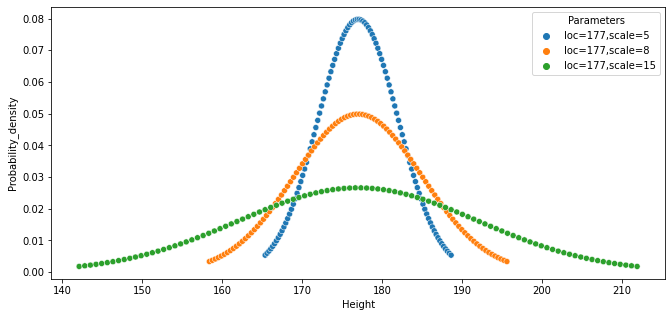
更改 scale(标准差)

不同标准差下正态分布的理论概率密度函数

Python 中的蒙特卡洛模拟

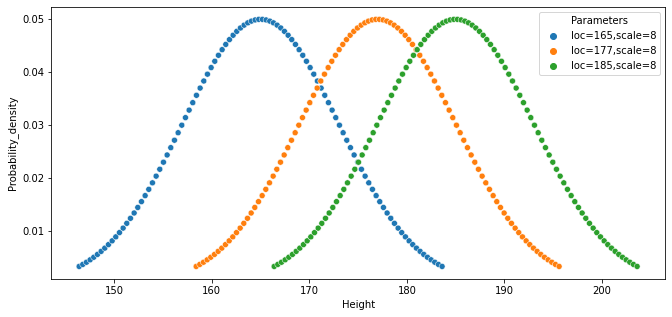
更改 loc(均值)

不同均值下正态分布的理论概率密度函数

Python 中的蒙特卡洛模拟

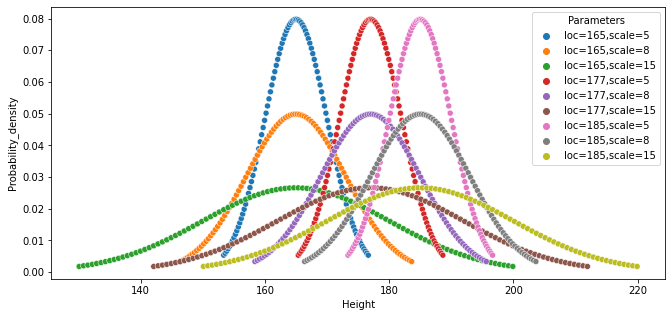
同时更改 scale 与 loc

不同标准差与均值下正态分布的理论概率密度函数

Python 中的蒙特卡洛模拟

从正态分布抽样

  • 美国成年男性身高服从正态分布;均值 = 177 cm;标准差 = 8 cm

  • 高于 190 cm 或低于 165 cm 的比例是多少?

heights = st.norm.rvs(loc=177, scale=8, size=10000)

qualified = (heights < 165) | (heights > 190)
print(np.sum(qualified) * 100/10000)
12.28
Python 中的蒙特卡洛模拟

绘制模拟结果

heights_dict = {"heights":heights}
sns.histplot(x="heights", data=heights_dict)
plt.axvline(x=165, color="red")
plt.axvline(x=190, color="red")
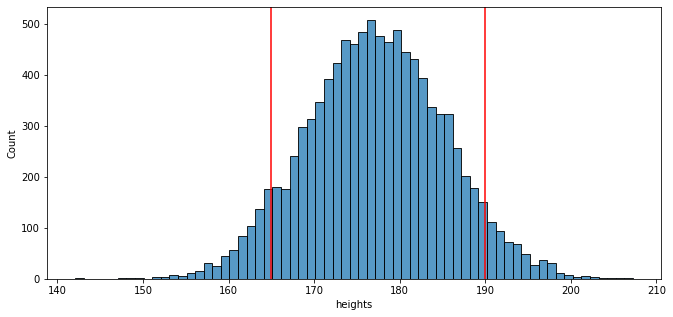
从正态分布抽样得到的直方图

Python 中的蒙特卡洛模拟

更多连续型概率分布

  • 连续型均匀分布(st.uniform
    • 离散均匀分布的连续对应物
  • 指数分布(st.expon
    • 几何分布的连续对应物
1 https://docs.scipy.org/doc/scipy/tutorial/stats/continuous.html
Python 中的蒙特卡洛模拟

Passons à la pratique !

Python 中的蒙特卡洛模拟

Preparing Video For Download...