(年化)夏普比率
R 中的投资组合分析入门

Kris Boudt
Professor, Free University Brussels & Amsterdam
绩效基准比较
绩效基准比较
风险-收益权衡
风险-收益权衡
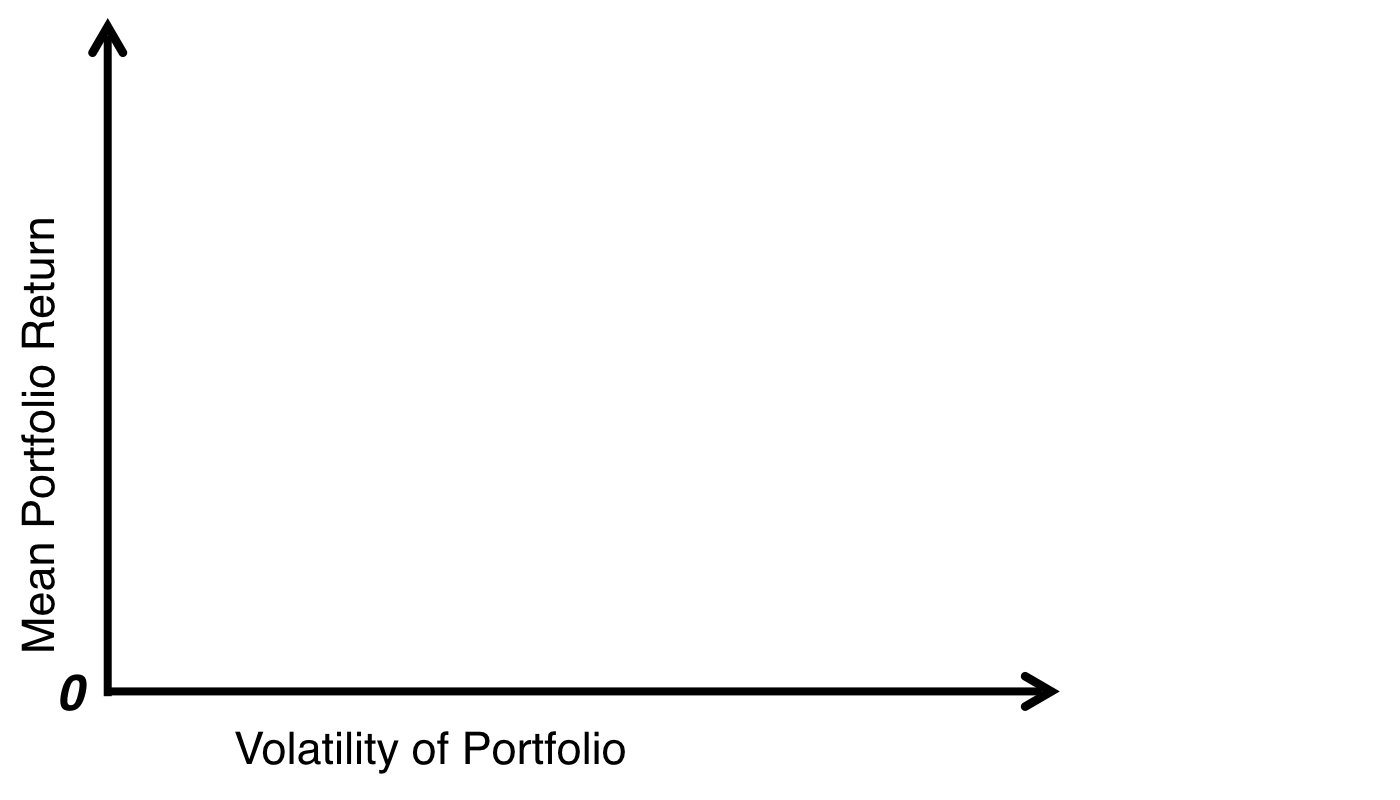
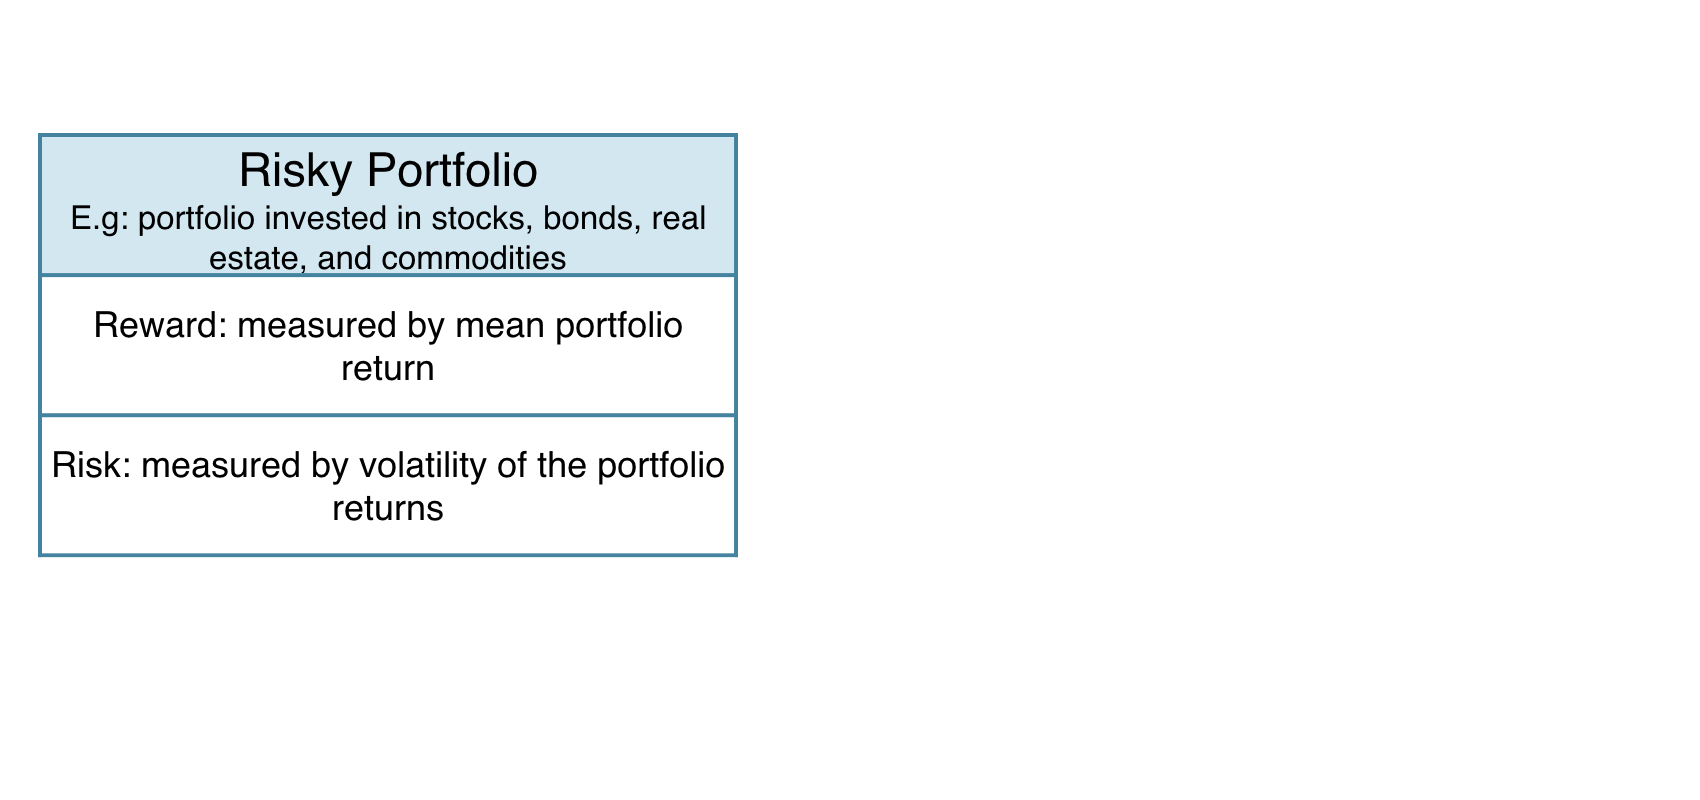
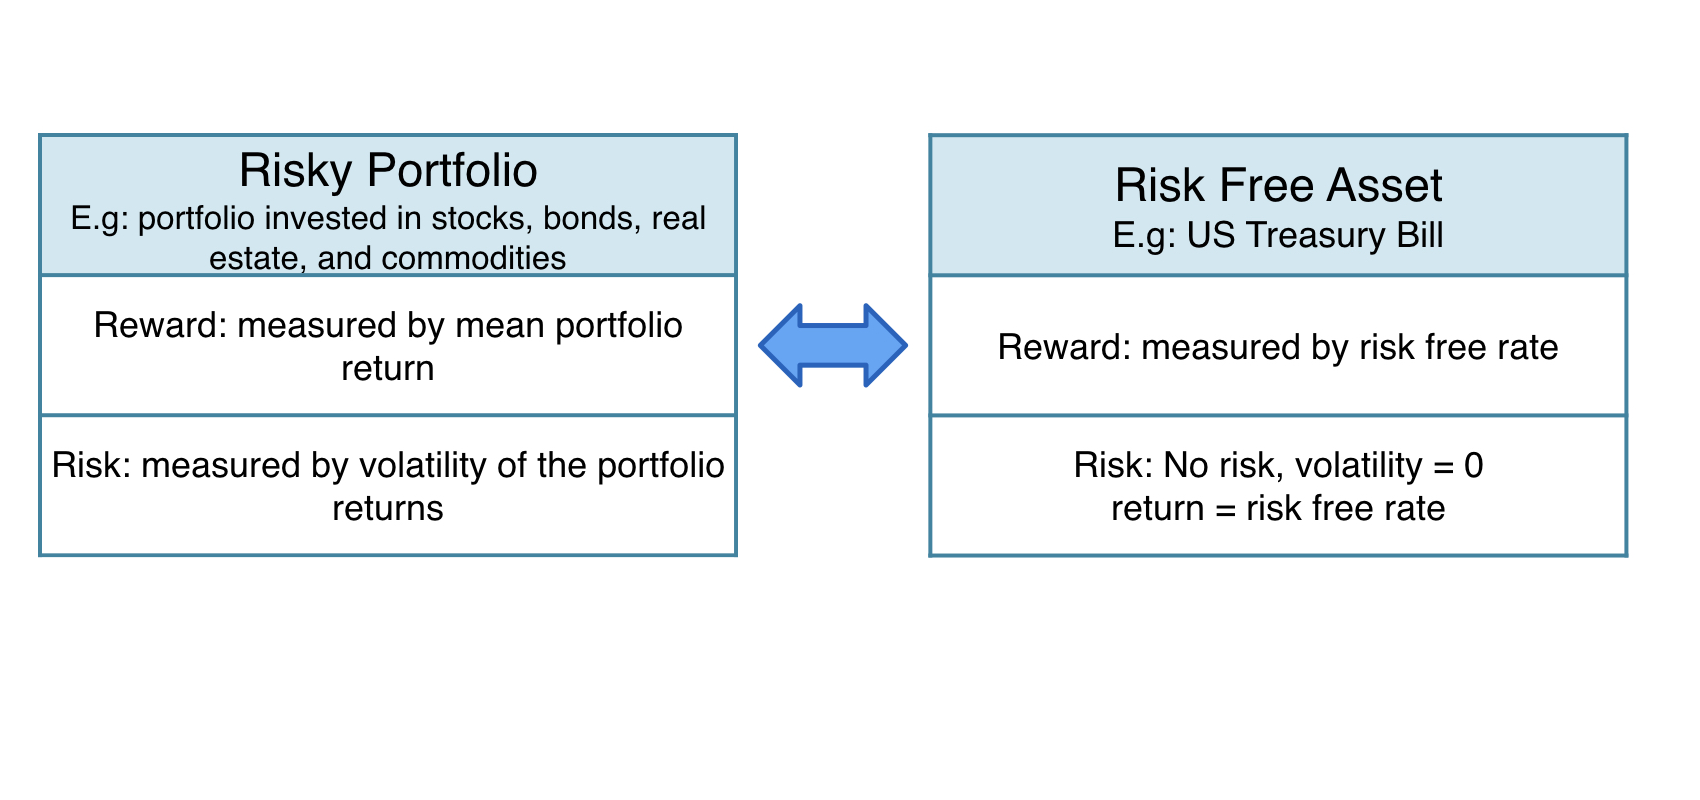
风险-收益权衡
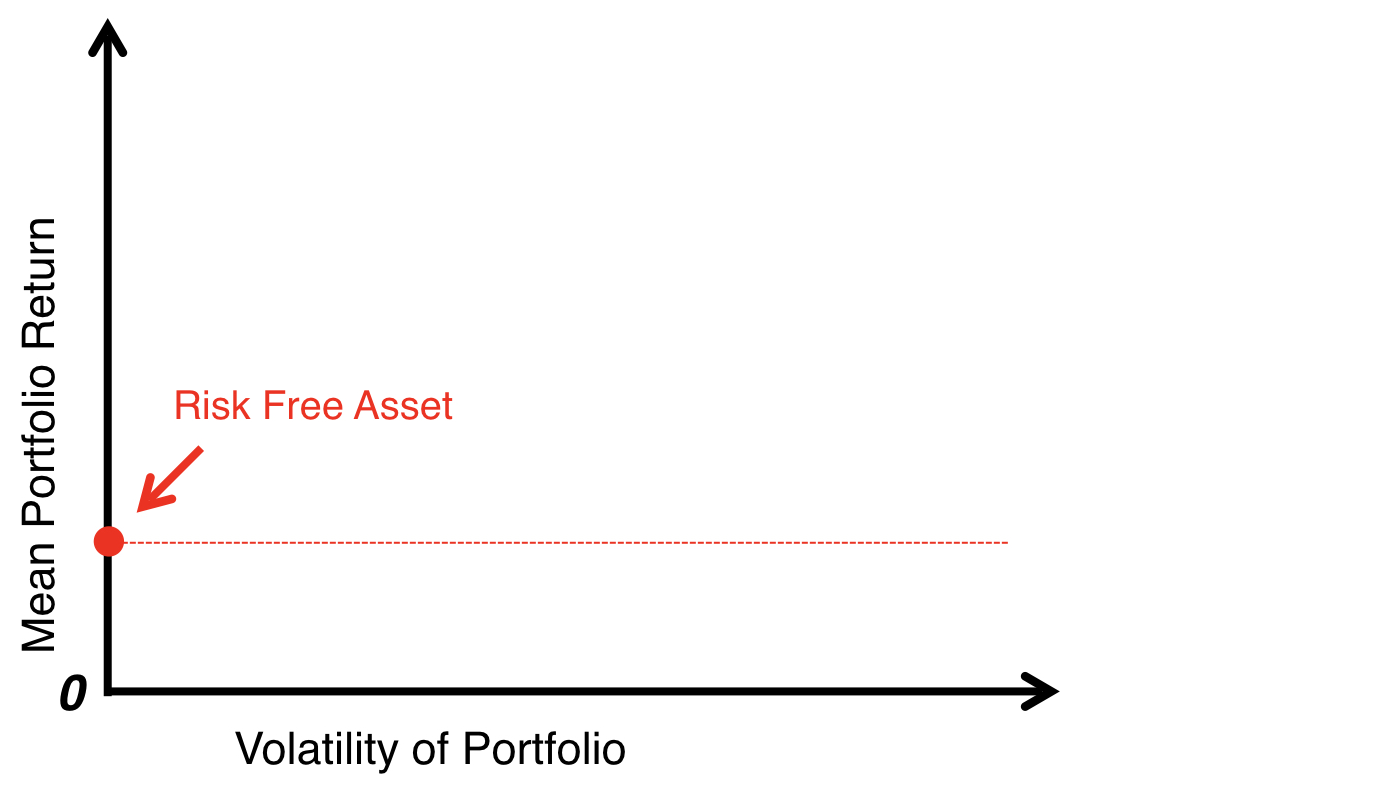
风险-收益权衡
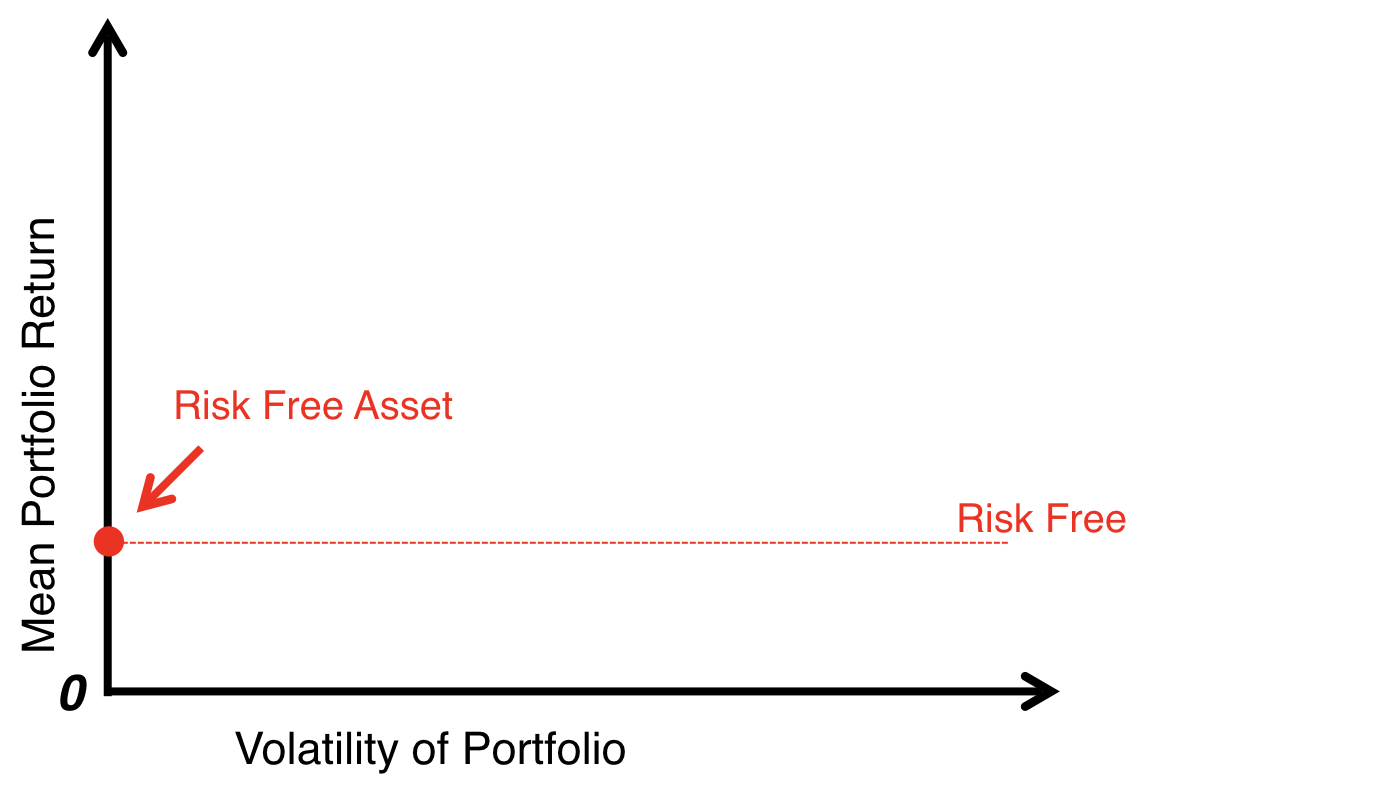
风险-收益权衡
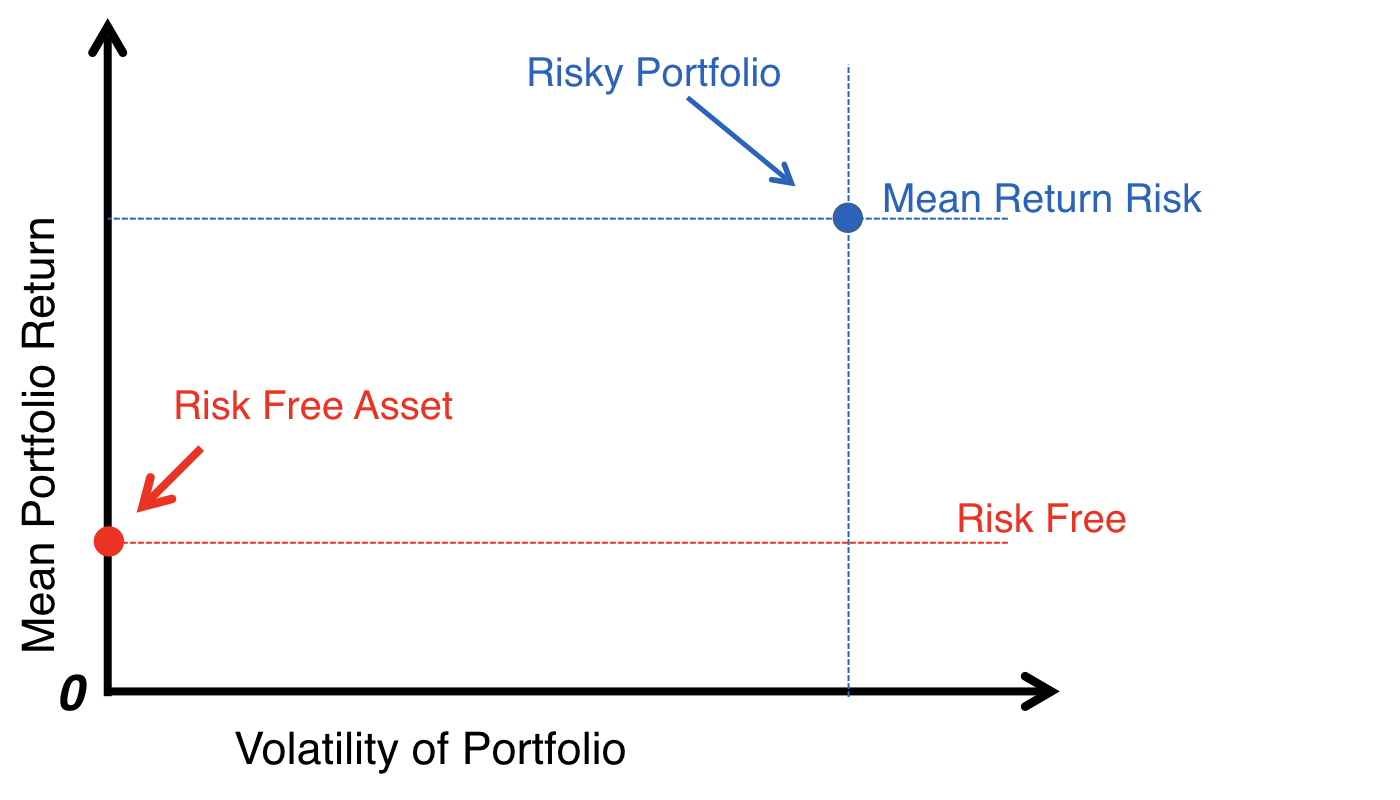
风险-收益权衡
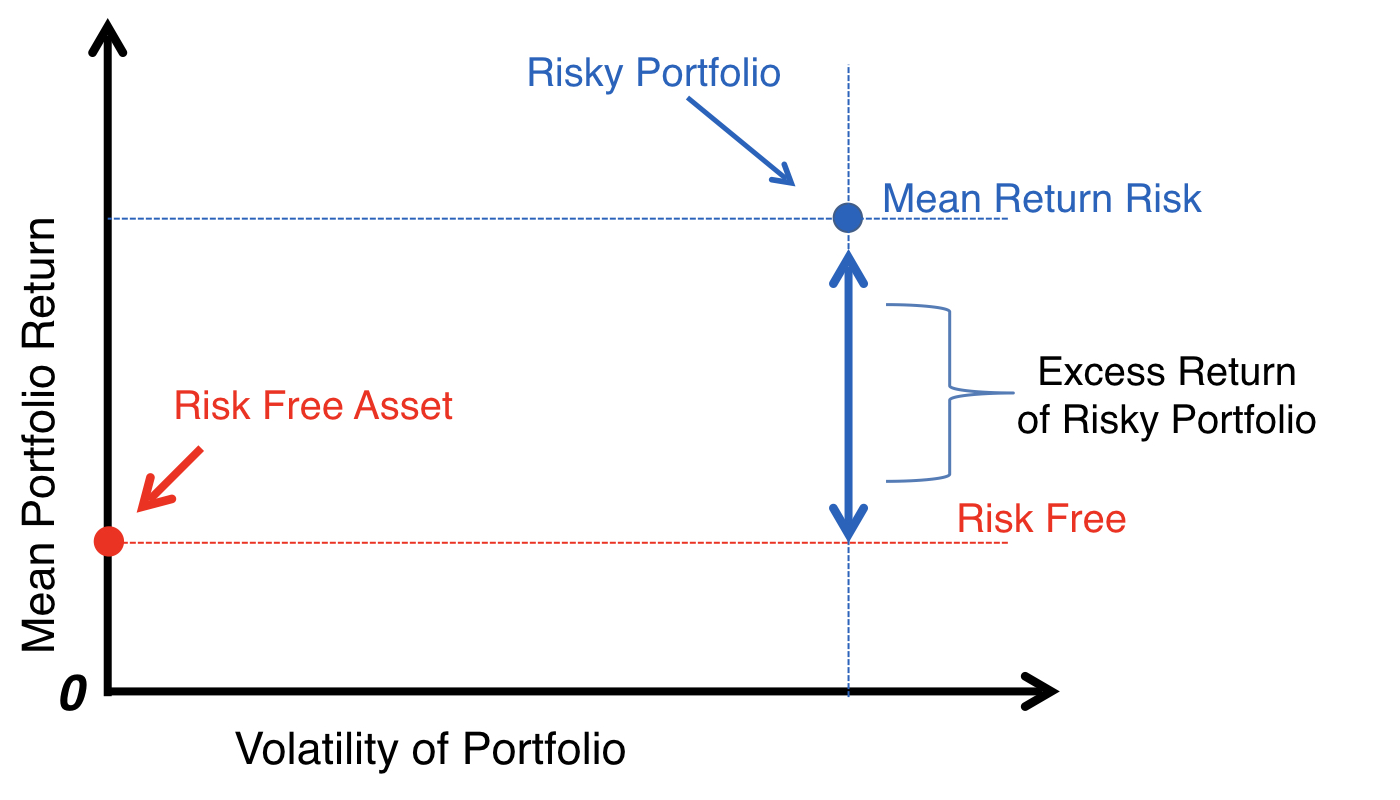
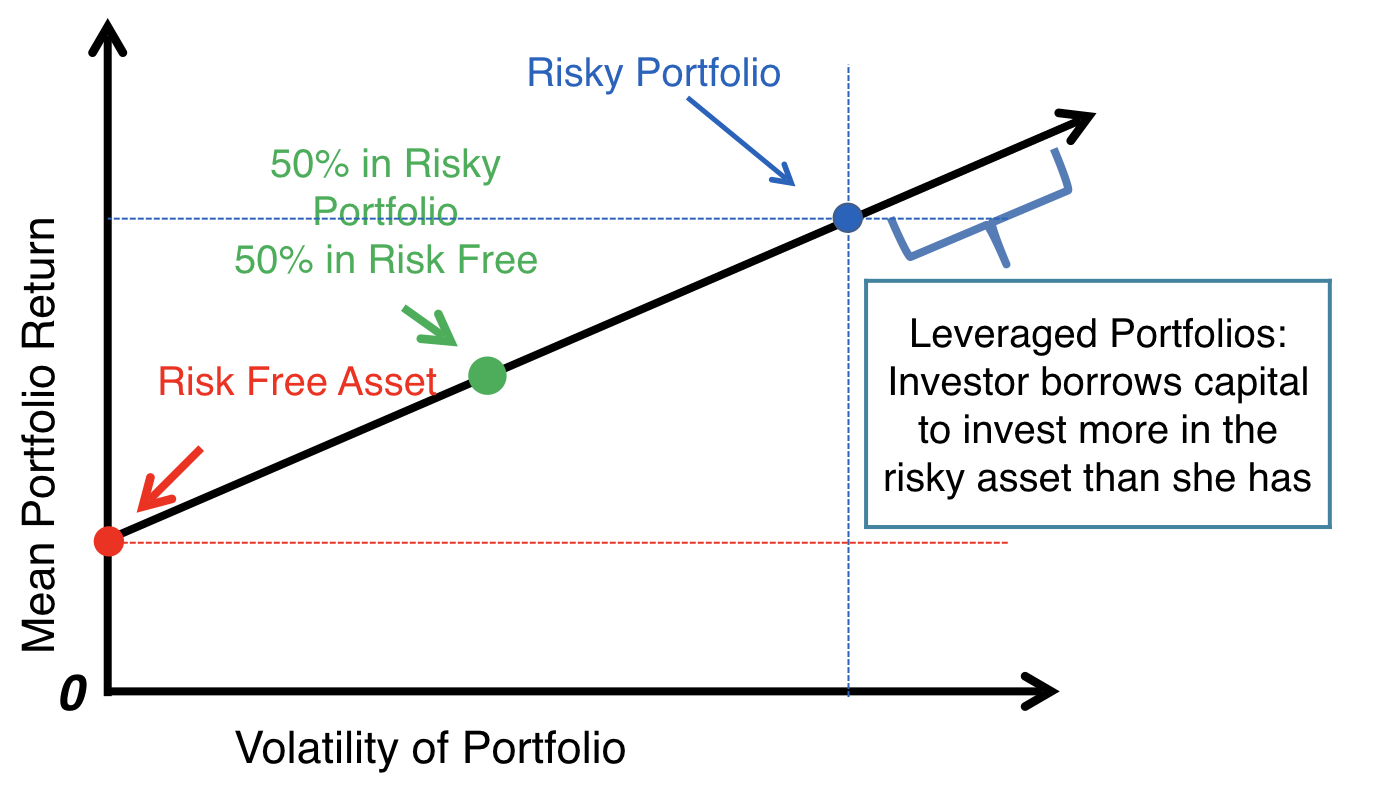
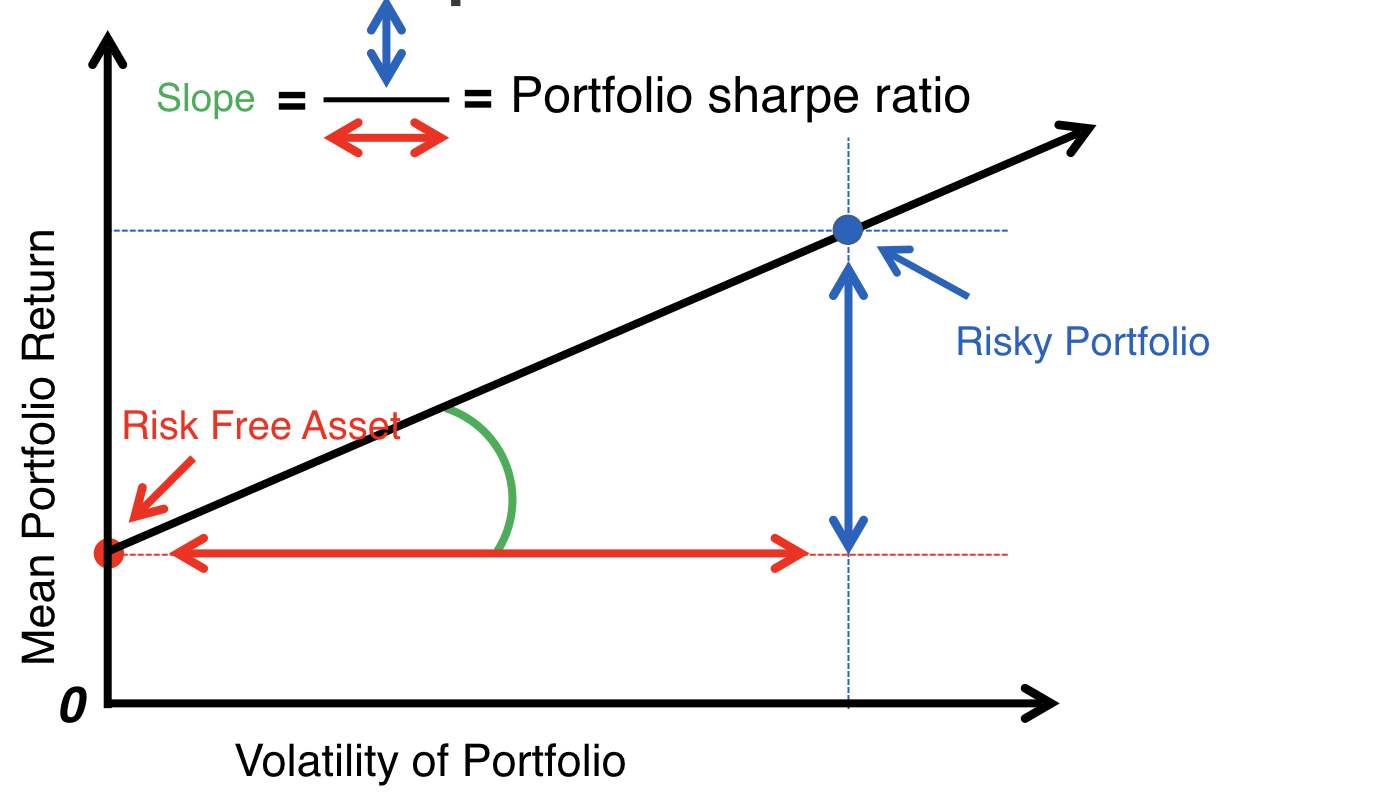
资本配置线
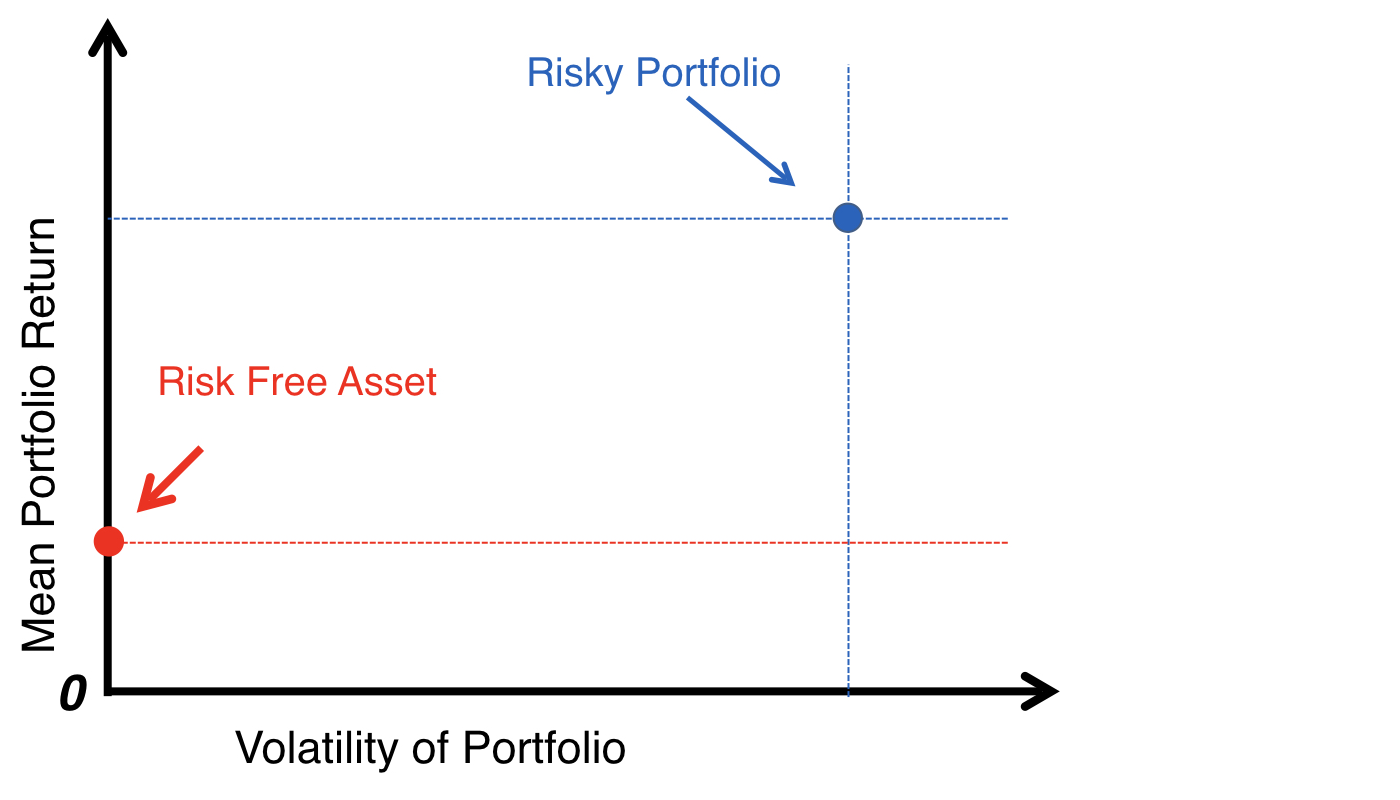
资本配置线
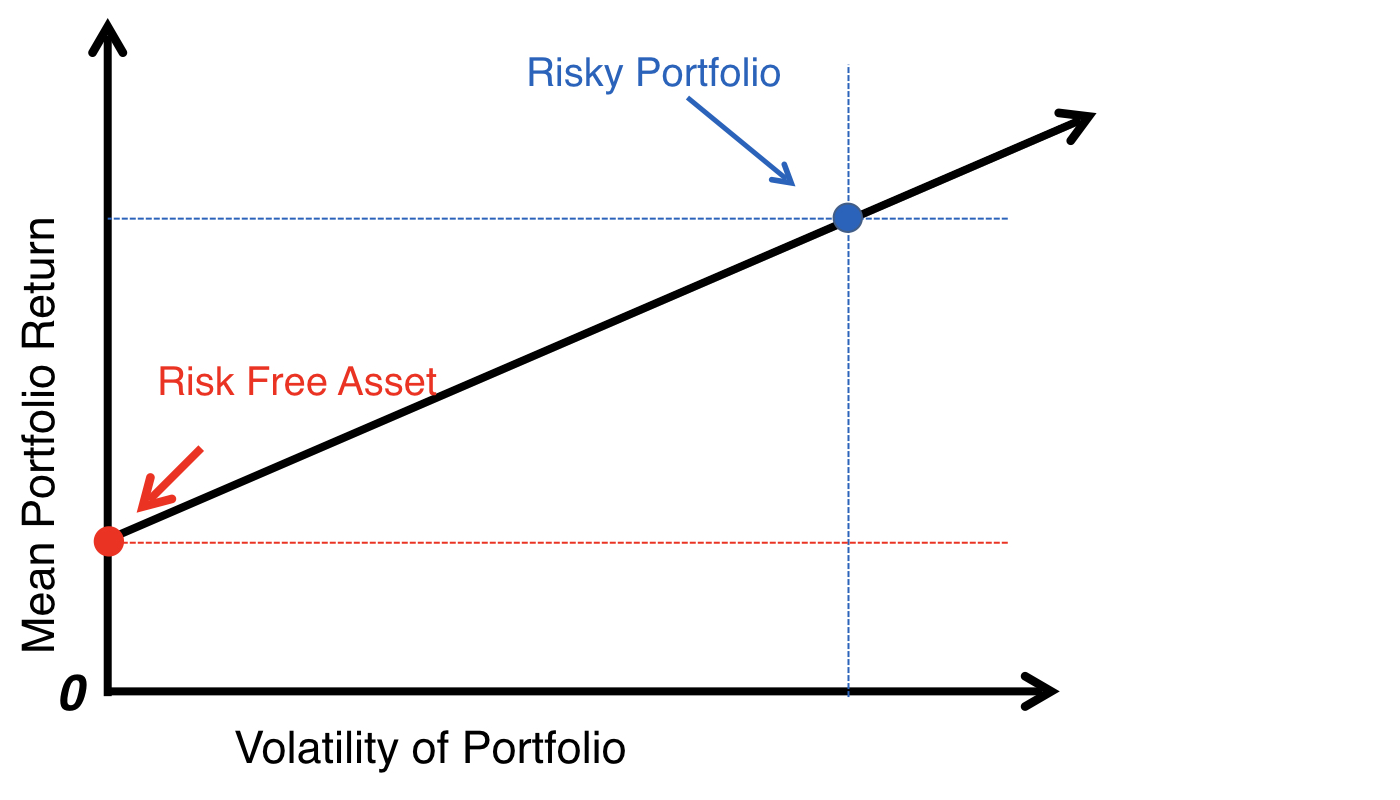
资本配置线
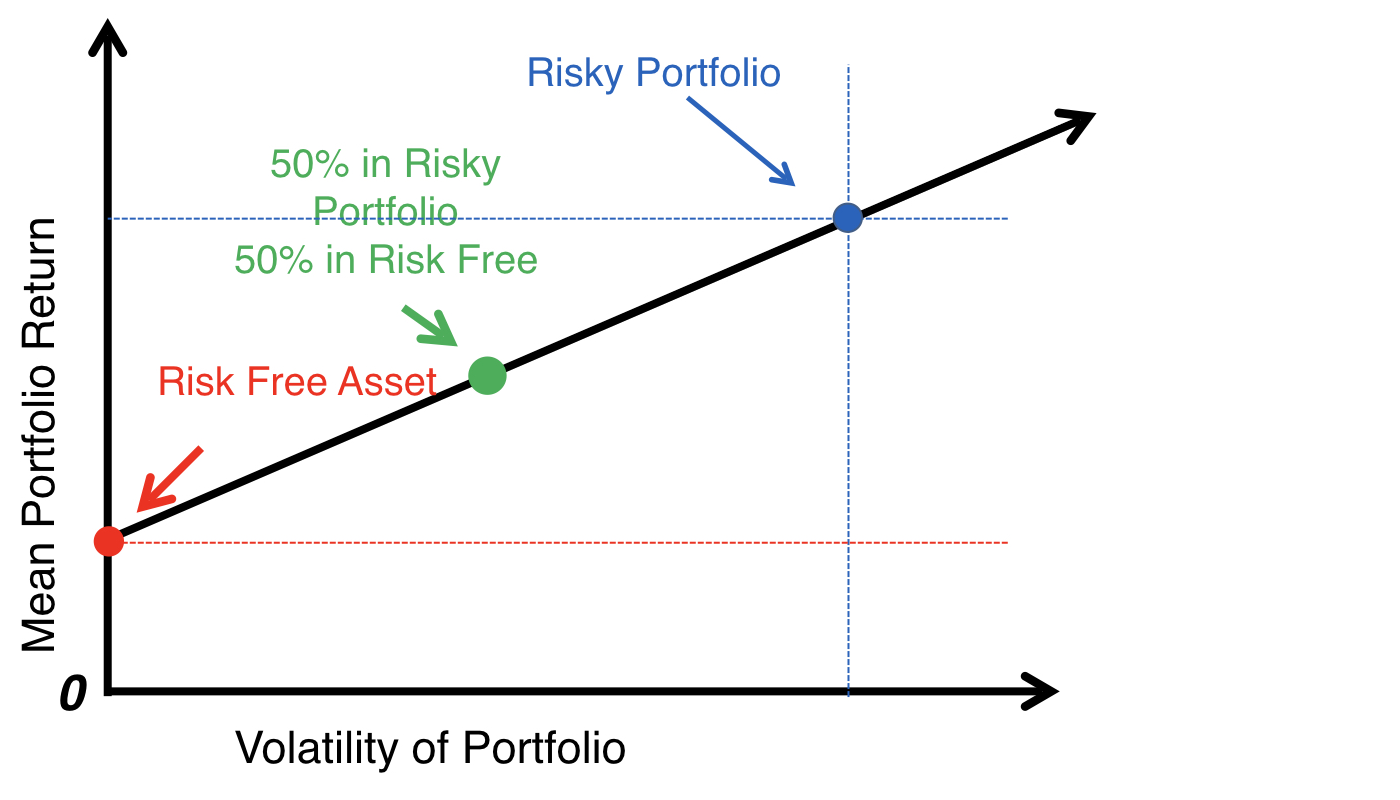
资本配置线
夏普比率
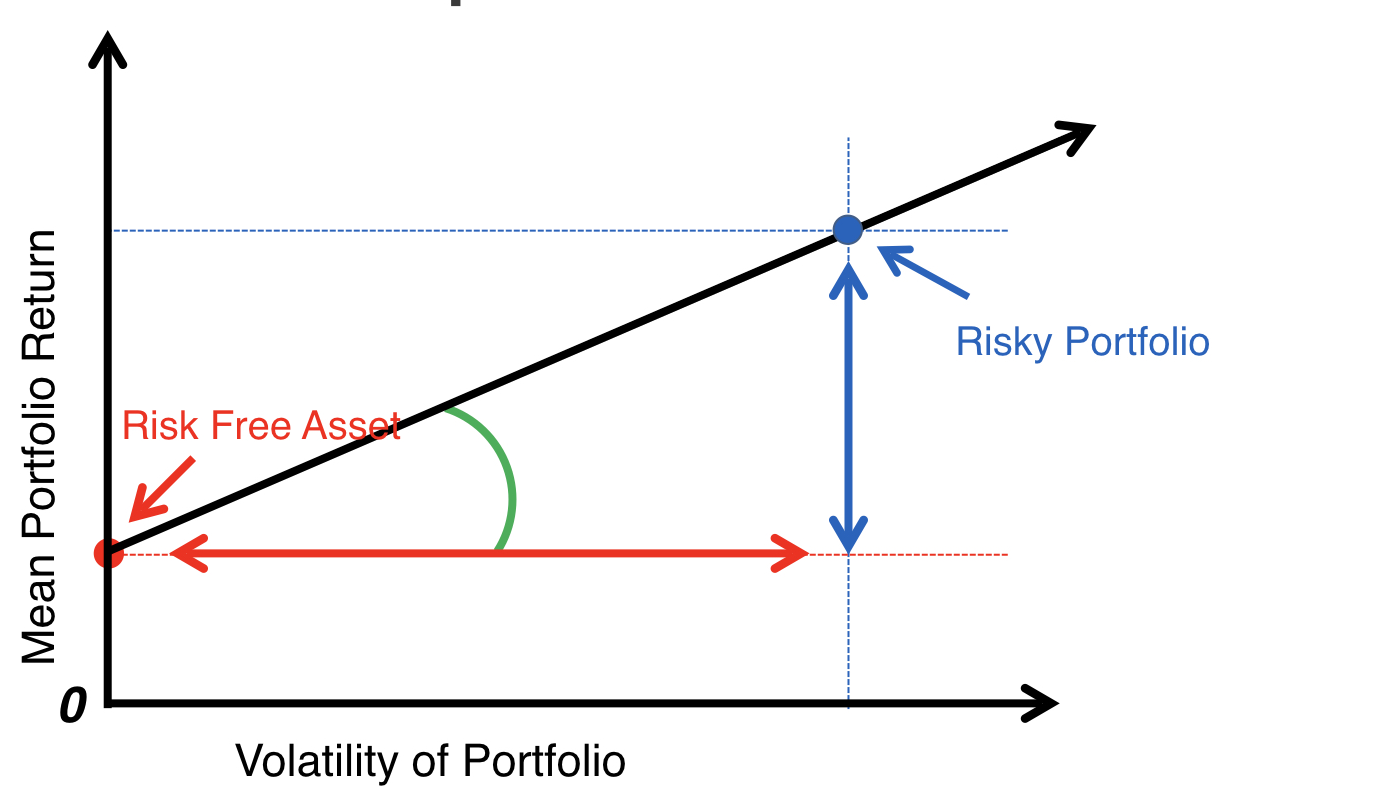
夏普比率
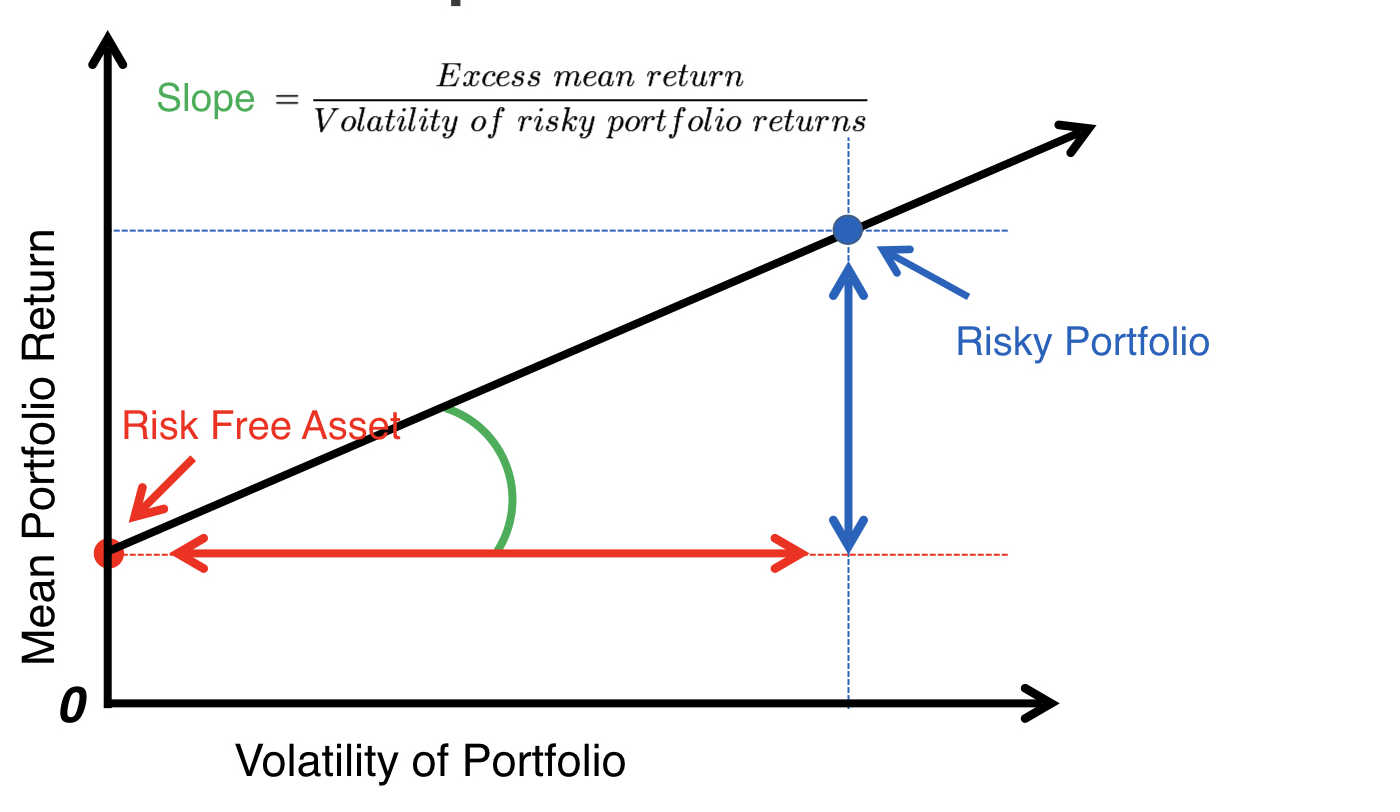
夏普比率
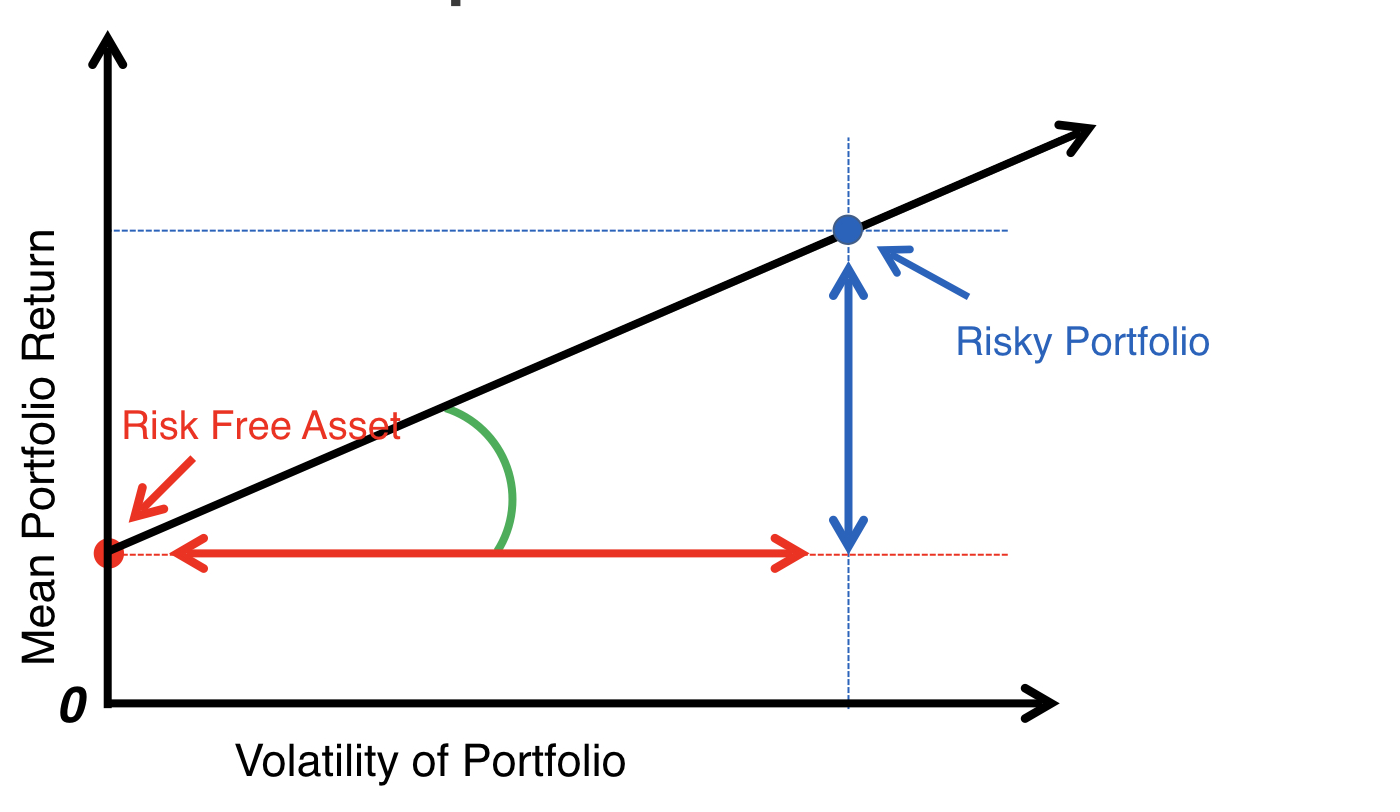
夏普比率
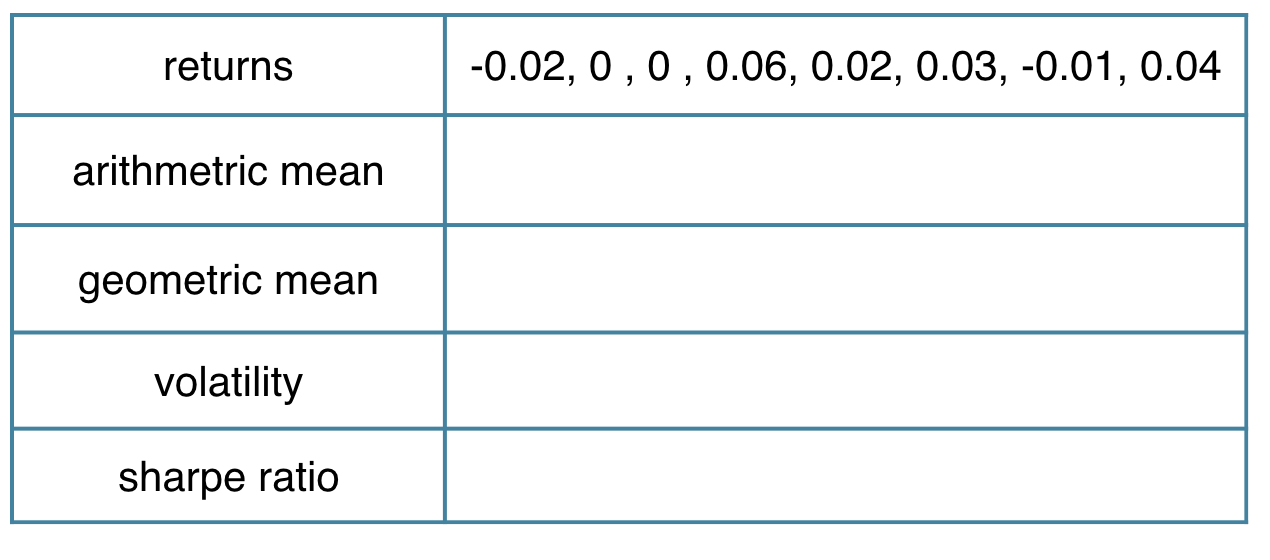
绩效统计实操
library(PerformanceAnalytics)
sample_returns <- c(-0.02, 0.00, 0.00, 0.06, 0.02, 0.03, -0.01, 0.04)
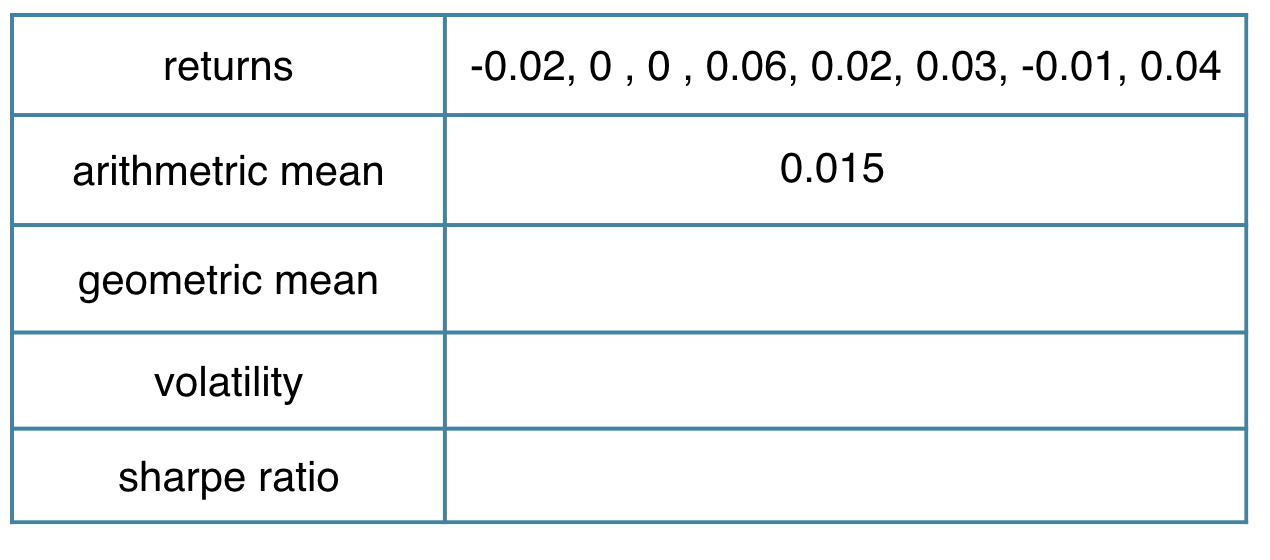
绩效统计实操
library(PerformanceAnalytics)
sample_returns <- c(-0.02, 0.00, 0.00, 0.06, 0.02, 0.03, -0.01, 0.04)
mean(sample_returns)
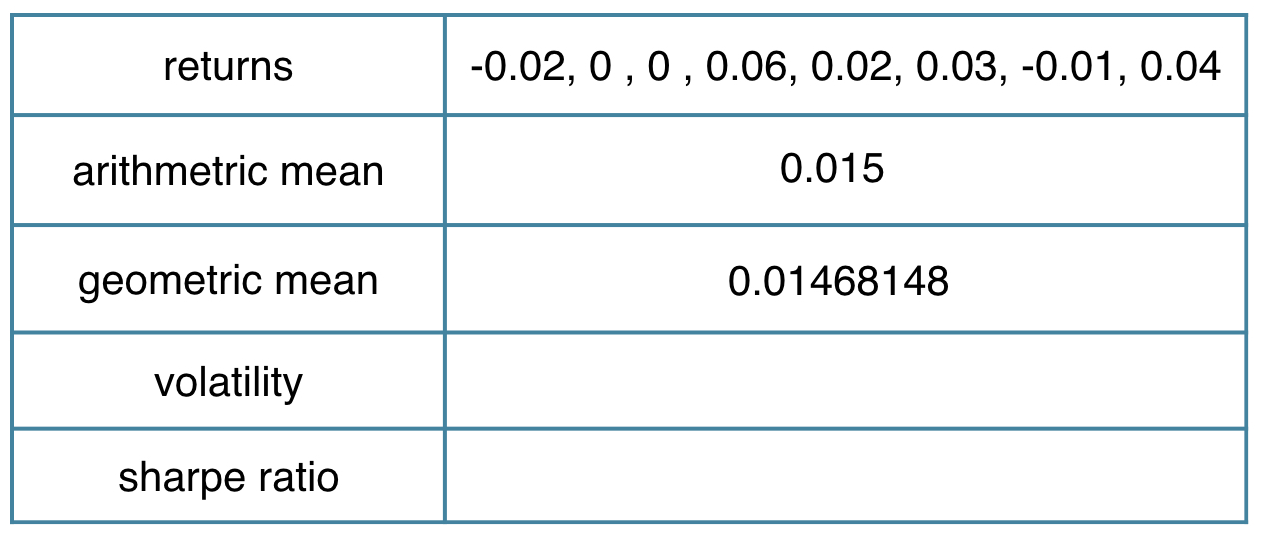
绩效统计实操
library(PerformanceAnalytics)
sample_returns <- c(-0.02, 0.00, 0.00, 0.06, 0.02, 0.03, -0.01, 0.04)
mean.geometric(sample_returns)
绩效统计实操
library(PerformanceAnalytics)
sample_returns <- c(-0.02, 0.00, 0.00, 0.06, 0.02, 0.03, -0.01, 0.04)
StdDev(sample_returns)
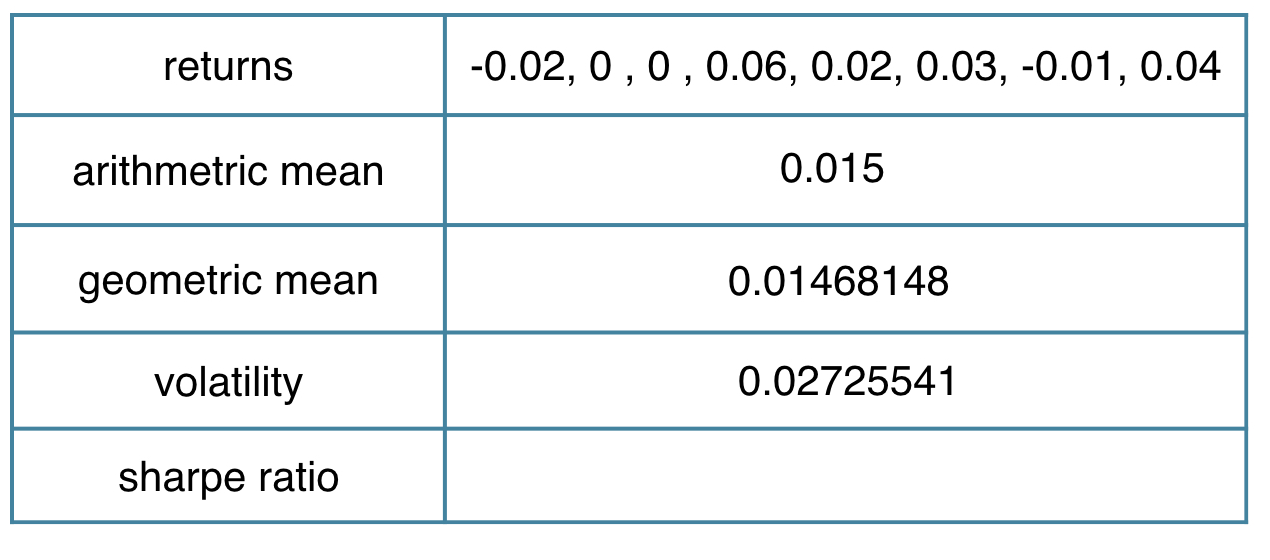
绩效统计实操
library(PerformanceAnalytics)
sample_returns <- c(-0.02, 0.00, 0.00, 0.06, 0.02, 0.03, -0.01, 0.04)
(mean(sample_returns)-0.004)/StdDev(sample_returns)
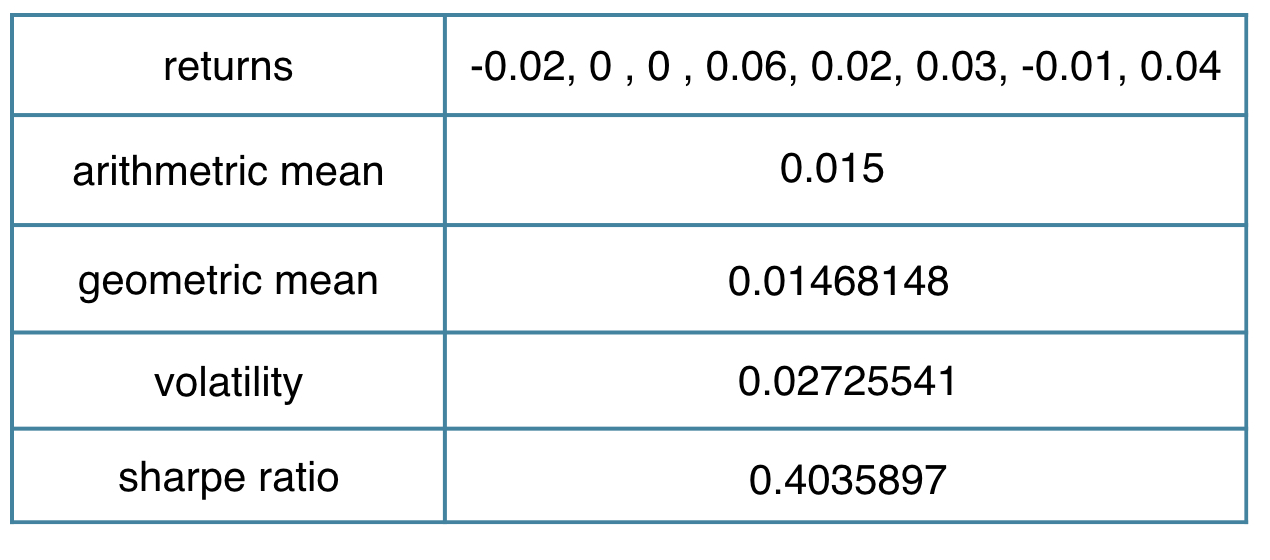
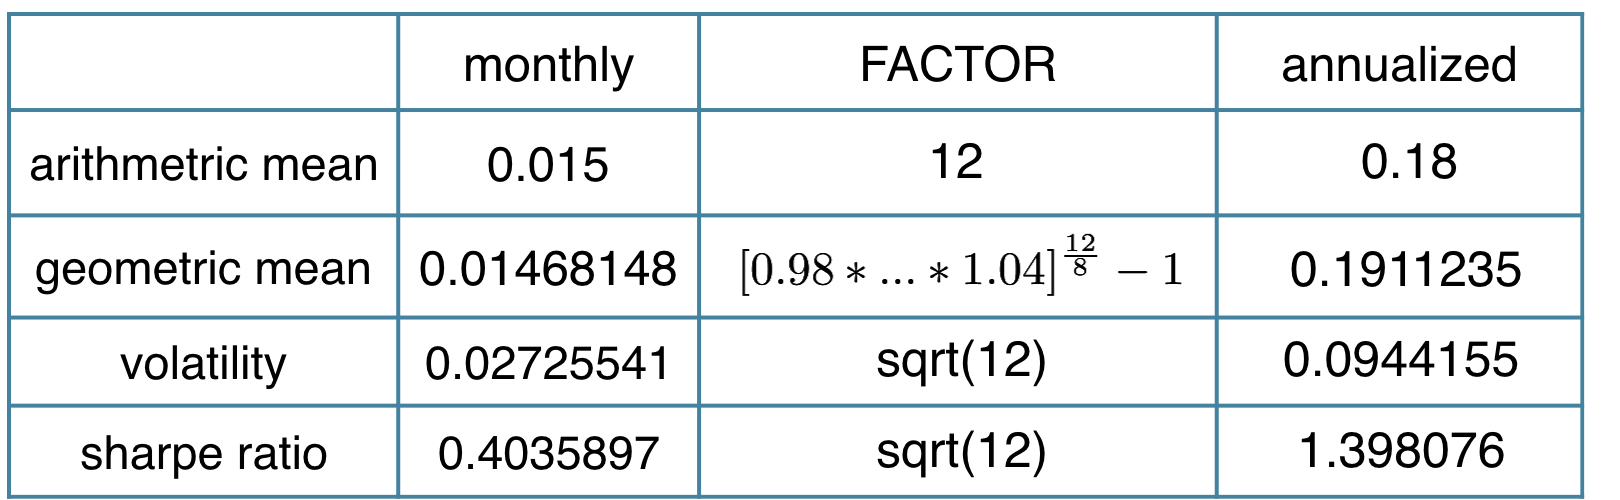
月度绩效年化
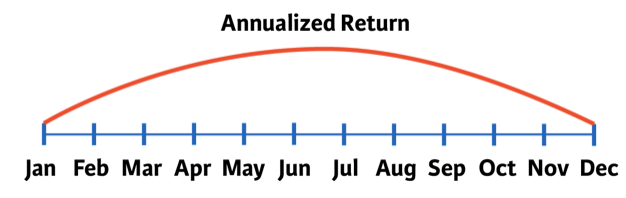
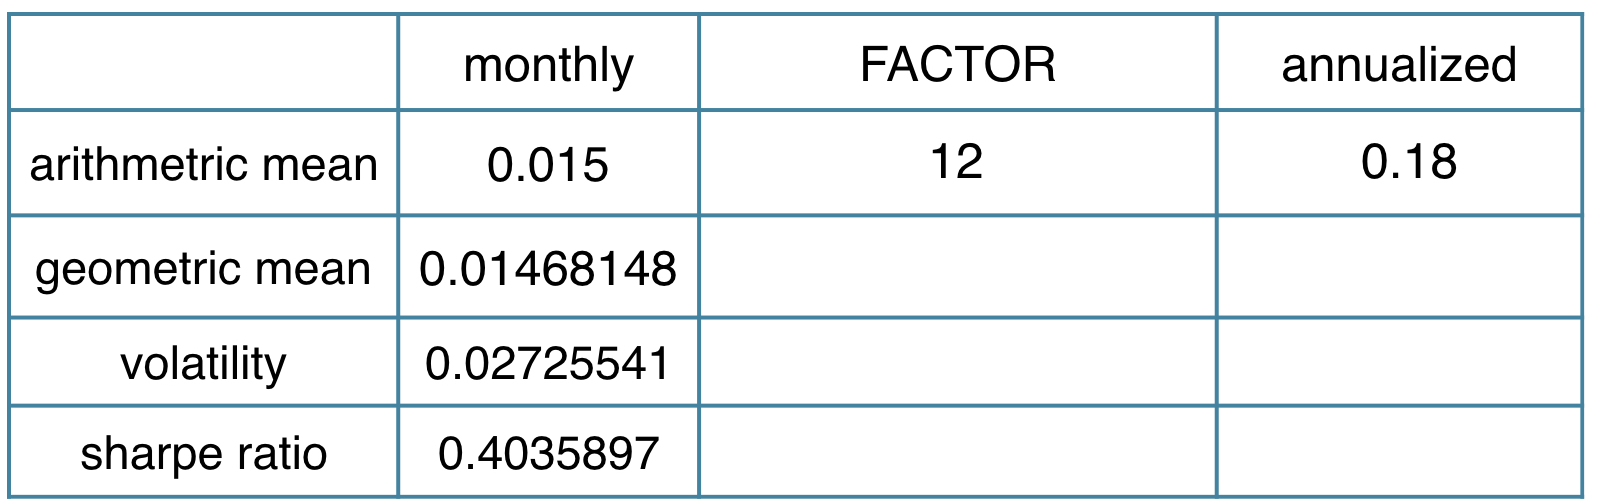
- 算术均值:月均值 * 12
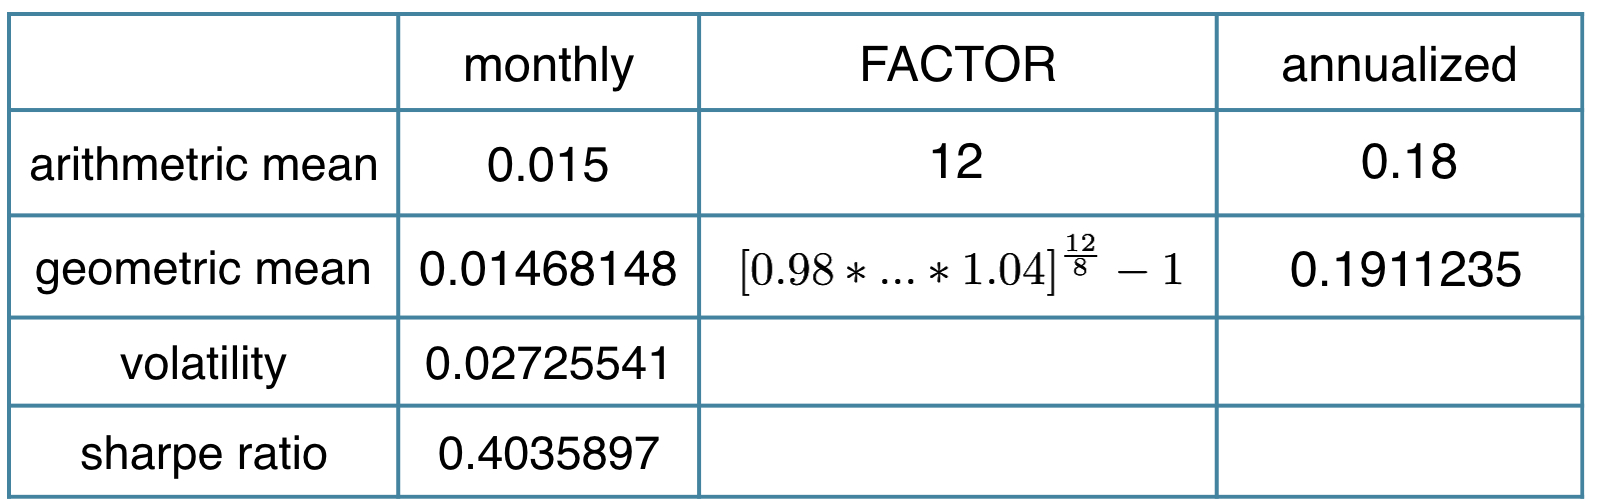
- 几何均值($R_i$ 为月度收益):
- $[(1+R_1)\cdot(1+R_2)\cdot...\cdot(1+R_T)]^{12/T} -1$
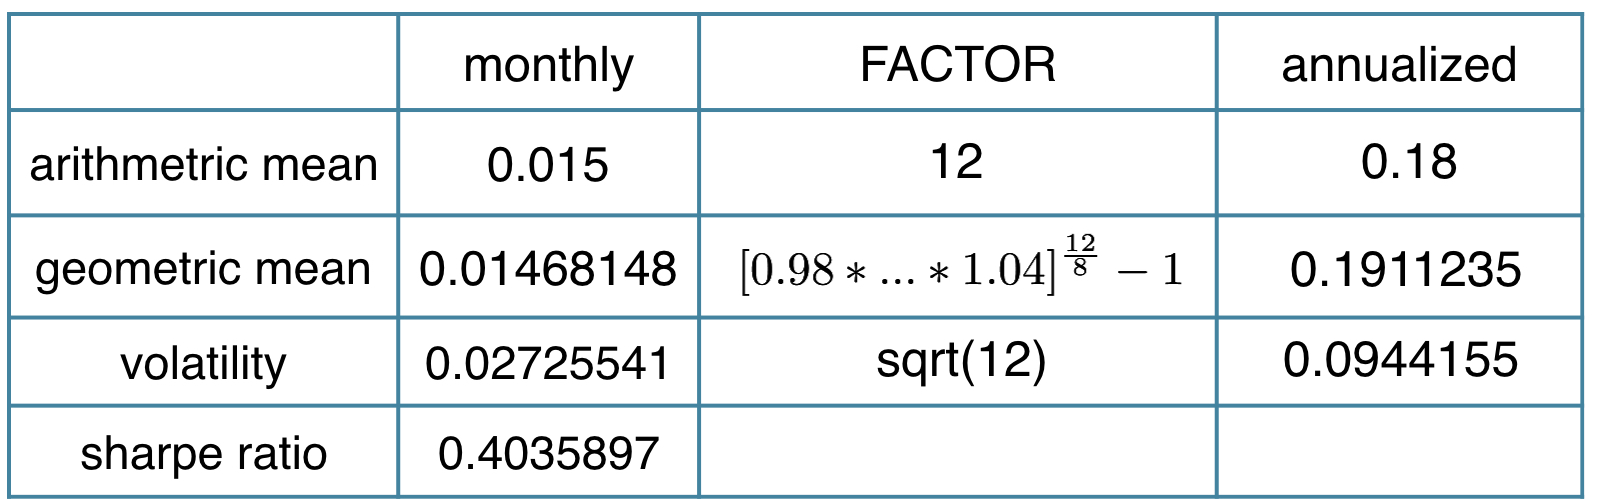
- 波动率:月波动率 * sqrt(12)
绩效统计实操
library(PerformanceAnalytics)
sample_returns <- c( -0.02, 0.00, 0.00, 0.06, 0.02, 0.03, -0.01, 0.04)
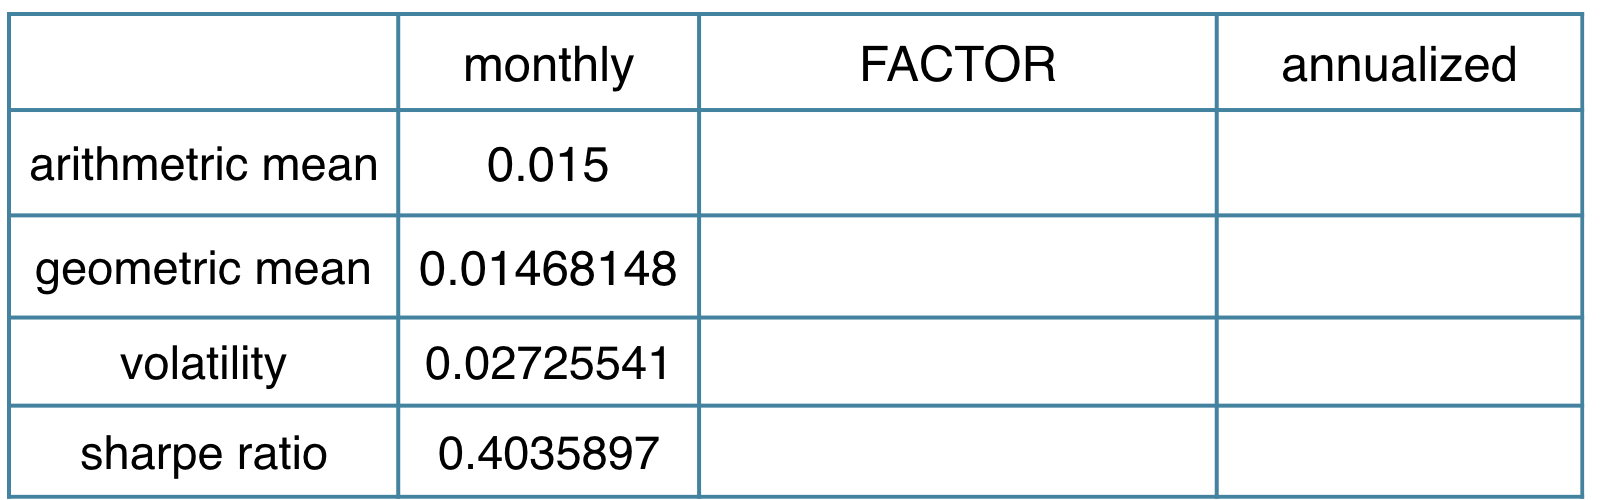
绩效统计实操
library(PerformanceAnalytics)
sample_returns <- c( -0.02, 0.00, 0.00, 0.06, 0.02, 0.03, -0.01, 0.04)
Return.annualized(sample_returns, scale = 12, geometric = FALSE)
绩效统计实操
library(PerformanceAnalytics)
sample_returns <- c( -0.02, 0.00, 0.00, 0.06, 0.02, 0.03, -0.01, 0.04)
Return.annualized(sample_returns, scale = 12, geometric = TRUE)
绩效统计实操
library(PerformanceAnalytics)
sample_returns <- c( -0.02, 0.00, 0.00, 0.06, 0.02, 0.03, -0.01, 0.04)
Std.Dev.annualized(sample_returns, scale = 12)
绩效统计实操
library(PerformanceAnalytics)
sample_returns <- c( -0.02, 0.00, 0.00, 0.06, 0.02, 0.03, -0.01, 0.04)
Return.annualized(sample_returns, scale = 12)/
    Std.Dev.annualized(sample_returns, scale = 12)