解读结果与比较模型

Python 中的贝叶斯数据分析

Michal Oleszak

Machine Learning Engineer

再次运行模型

formula = "num_clicks ~ clothes_banners_shown + sneakers_banners_shown"

with pm.Model() as model_1:
    pm.GLM.from_formula(formula, data=ads_aggregated)
    trace_1 = pm.sample(draws=1000, tune=500)
Python 中的贝叶斯数据分析

再次运行模型

formula = "num_clicks ~ clothes_banners_shown + sneakers_banners_shown"

with pm.Model() as model_1:
    pm.GLM.from_formula(formula, data=ads_aggregated)
    trace_1 = pm.sample(draws=1000, tune=500, chains=4)
  • 参数数量:4
  • 每个参数的抽样次数:1000 $\times$ 4 = 4000
Python 中的贝叶斯数据分析

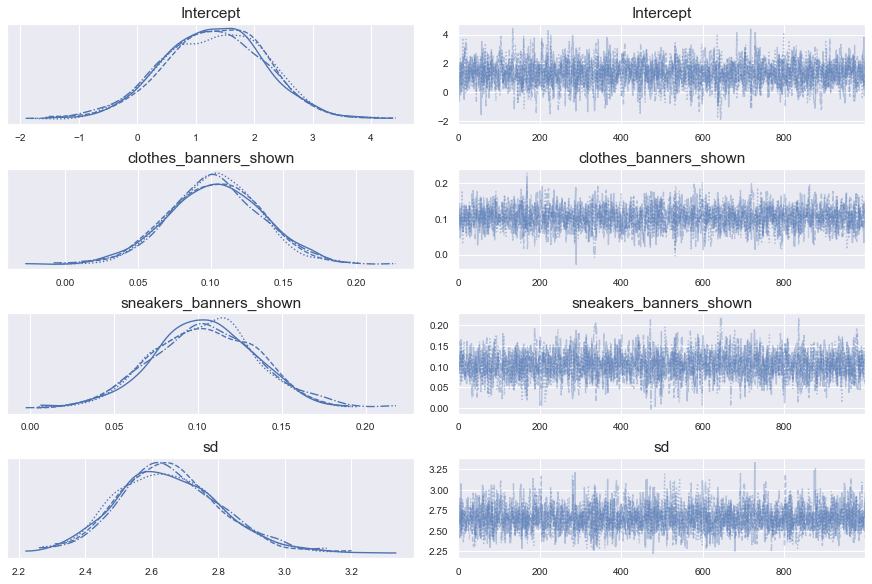
轨迹图

pm.traceplot(trace_1)

一个由八个图组成的网格,二列四行。左列为四个密度图,右列为四个折线图,每个对应一个模型参数。

Python 中的贝叶斯数据分析

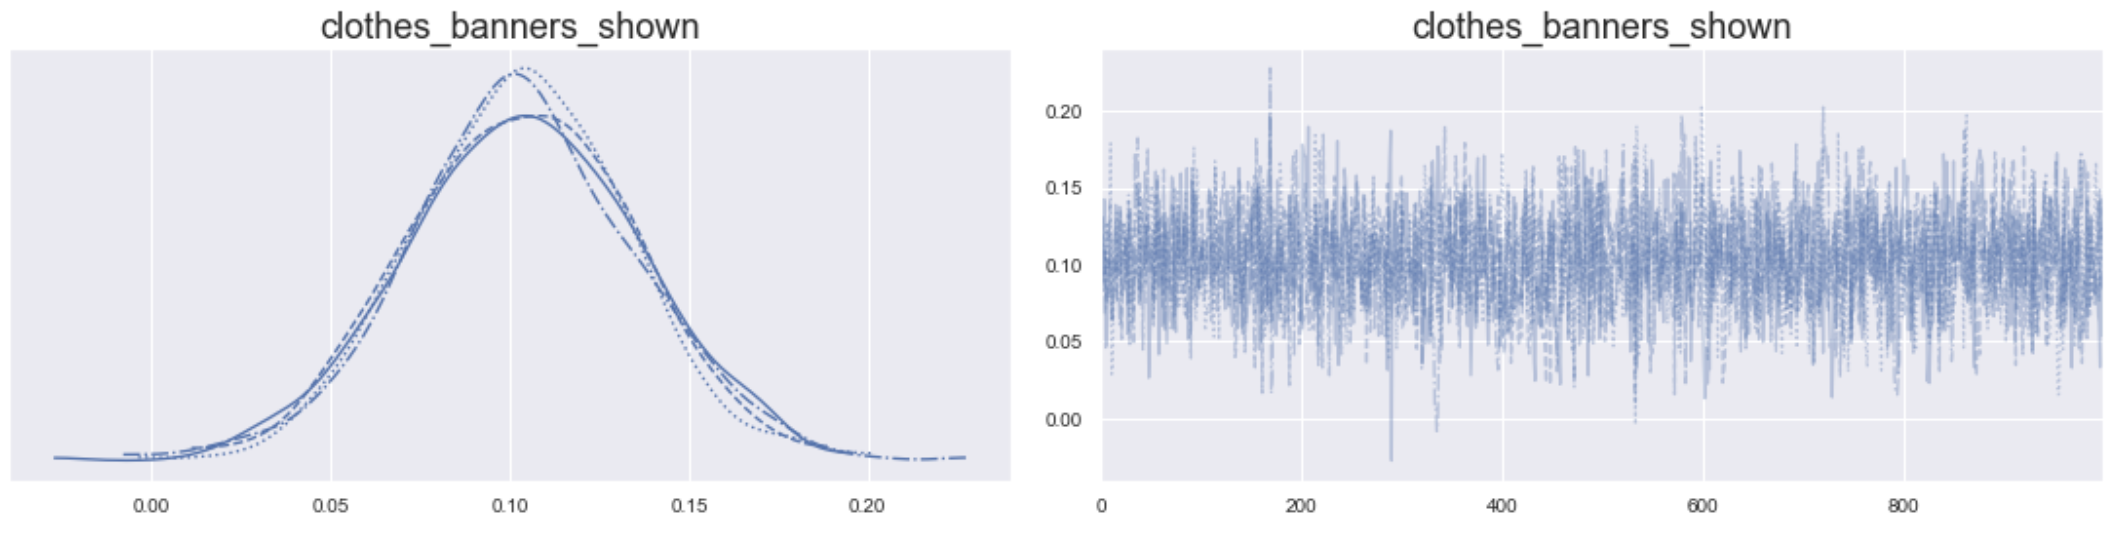
轨迹图:放大单个参数


并排两个图:左为密度图,右为参数抽样的折线图。

Python 中的贝叶斯数据分析

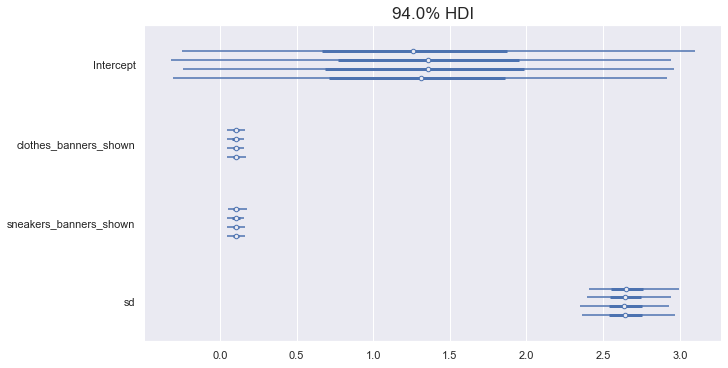
森林图

pm.forestplot(trace_1)

一个图,展示每个模型参数的抽样分布,以水平线表示。

Python 中的贝叶斯数据分析

轨迹摘要

pm.summary(trace_1)
                         mean     sd  hdi_3%  hdi_97%  mcse_mean  mcse_sd  \
Intercept               1.307  0.886  -0.305    2.962      0.018    0.013   
clothes_banners_shown   0.103  0.031   0.043    0.160      0.001    0.000   
sneakers_banners_shown  0.104  0.032   0.045    0.163      0.001    0.001   
sd                      2.654  0.157   2.382    2.970      0.003    0.002   

                        ess_mean  ess_sd  ess_bulk  ess_tail  r_hat  
Intercept                 2346.0  2318.0    2351.0    2083.0    1.0  
clothes_banners_shown     2085.0  2085.0    2089.0    1868.0    1.0  
sneakers_banners_shown    2105.0  1953.0    2122.0    1869.0    1.0  
sd                        2615.0  2590.0    2646.0    1834.0    1.0
Python 中的贝叶斯数据分析

拟合另一个模型

formula = "num_clicks ~ clothes_banners_shown + sneakers_banners_shown + weekend"

with pm.Model() as model_2:
    pm.GLM.from_formula(formula, data=ads_aggregated)
    trace_2 = pm.sample(draws=1000, tune=500)
Python 中的贝叶斯数据分析

广义适用信息准则(WAIC)

comparison = pm.compare({"trace_1": trace_1, "trace_2": trace_2}, 
                        ic="waic", scale="deviance")
print(comparison)
        rank     waic   p_waic    d_waic    weight       se      dse warning  \
trace_2    0   -362.8   5.1576         0  0.513792  9.37269        0    True   
trace_1    1 -362.926  4.13318  0.126236  0.486208  9.48352  1.50682    True   

        waic_scale  
trace_2        log  
trace_1        log
Python 中的贝叶斯数据分析

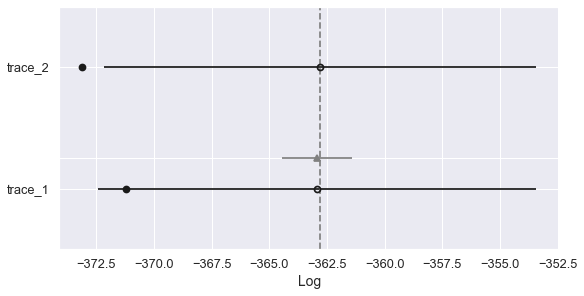
比较图

pm.compareplot(comparison)

一个可视化两个模型 WAIC 值的图。

Python 中的贝叶斯数据分析

让我们练习比较模型!

Python 中的贝叶斯数据分析

Preparing Video For Download...