精美表格

在 Tidyverse 中用数据进行沟通

Timo Grossenbacher

Data Journalist
在 Tidyverse 中用数据进行沟通

在 Tidyverse 中用数据进行沟通

用 YAML 头解决!

 ---
 title: "欧洲每周工作时长的减少" 
 subtitle: "1996–2006 年的变化"
 author: "Timo Grossenbacher"
 output: 
   html_document:
     theme: cosmo
     highlight: monochrome
     toc: true
     toc_float: false
     toc_depth: 4
     code_folding: hide
     css: styles.css

df_print: kable ---
    df_print: paged
 ---
在 Tidyverse 中用数据进行沟通

第二种方式

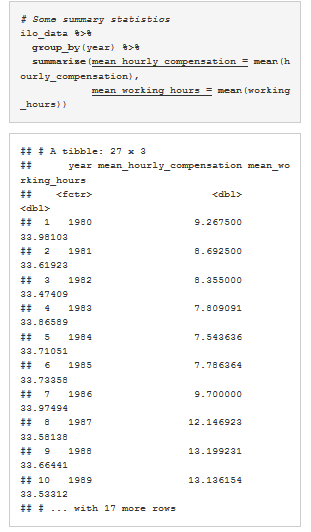
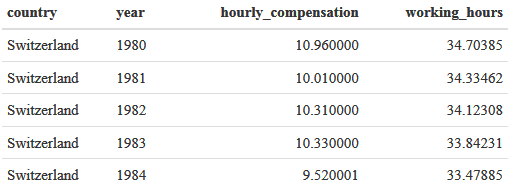
# 一些汇总统计
ilo_data %>%
  filter(country == "Switzerland" & year > 2000) %>% 

knitr::kable()

在 Tidyverse 中用数据进行沟通

表格样式

<table>
  <thead>
   ...
  </thead>
  <tbody>
   ...
  </tbody>
</table>
在 Tidyverse 中用数据进行沟通

表格样式

<table>
  <thead>
   <tr>
     ...
   </tr>
  </thead>
  <tbody>
   <tr>
     ...
   </tr>
   <tr>
     ...
   </tr>
  </tbody>
</table>
在 Tidyverse 中用数据进行沟通

表格样式

<table>
  <thead>
   <tr>
     <th>列 1</th><th>列 2</th>
   </tr>
  </thead>
  <tbody>
   <tr>
     <td>单元格 1</td><td>单元格 2</td>
   </tr>
   <tr>
     ...
   </tr>
  </tbody>
</table>
在 Tidyverse 中用数据进行沟通

Vamos praticar!

在 Tidyverse 中用数据进行沟通

Preparing Video For Download...