使用分面可视化数据特征

在 Tidyverse 中用数据进行沟通

Timo Grossenbacher

Data Journalist

facet_grid() 函数
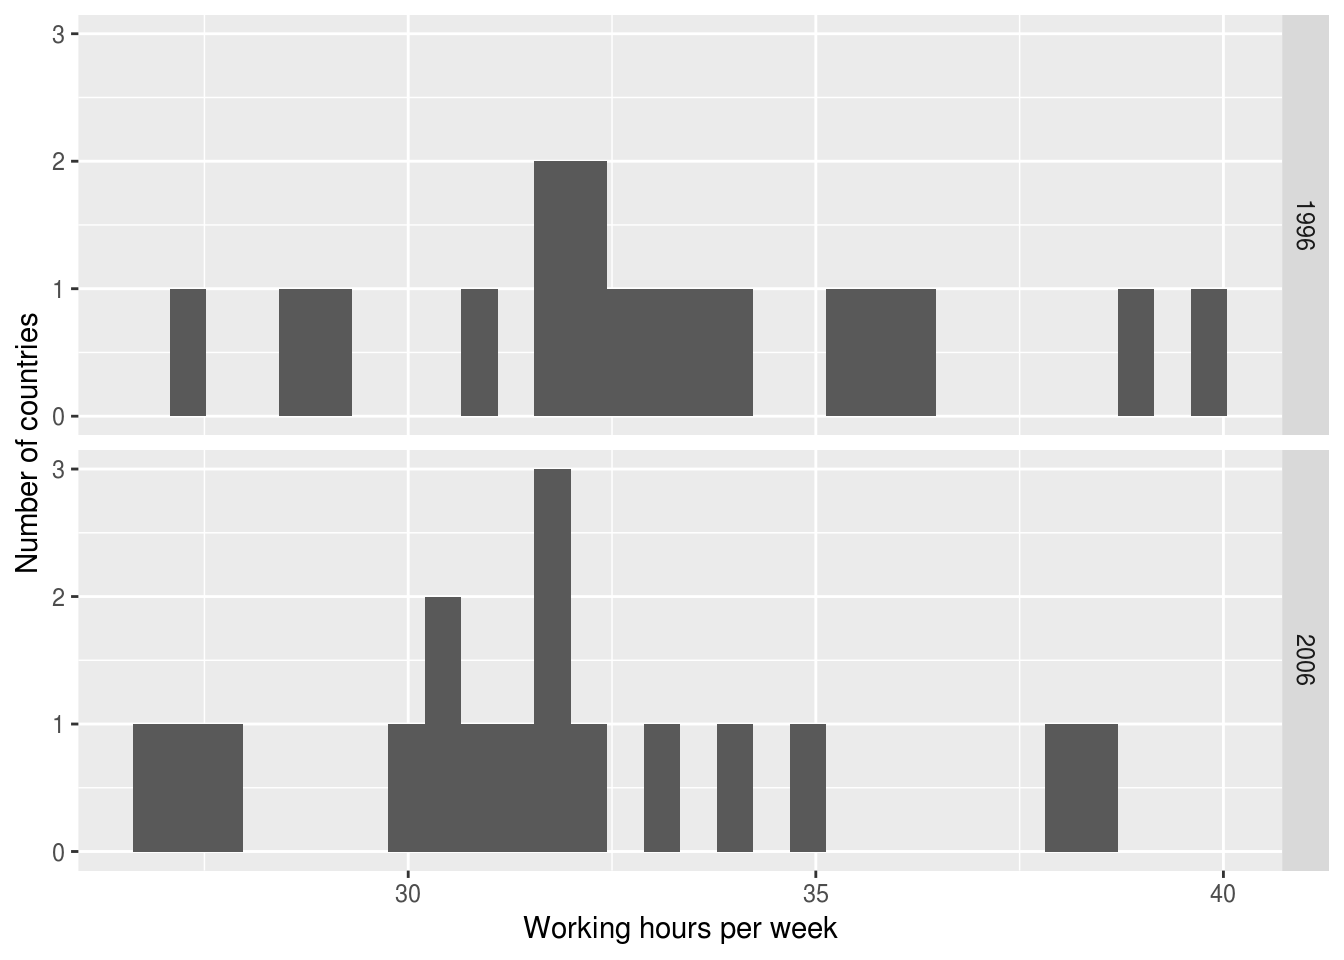
ilo_data <- ilo_data %>%
  filter(year == "1996" | year == "2006") 
ilo_plot <- ggplot(ilo_data) +
  geom_histogram(aes(
    x = working_hours)) +
  labs(x = "Working hours per week",
       y = "Number of countries")

ilo_plot +
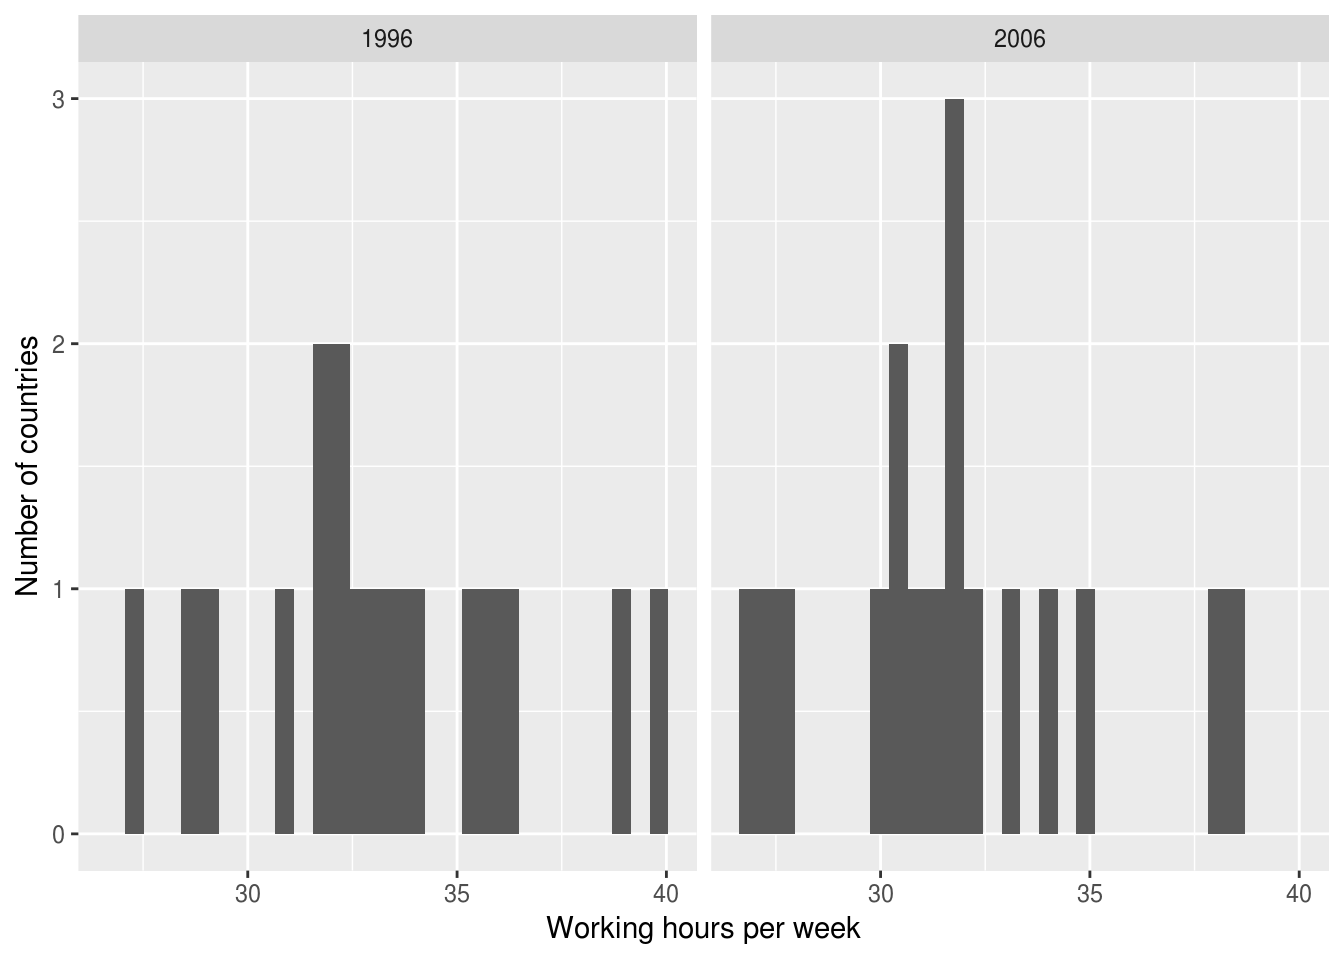
  facet_grid(cols = vars(year))
ilo_plot +
  facet_grid(rows = vars(year))

在 Tidyverse 中用数据进行沟通

facet_grid() 函数

ilo_data <- ilo_data %>%
  filter(year == "1996" | year == "2006")
ggplot(ilo_data) +
  geom_histogram(aes(x = working_hours)) +
  labs(x = "Working hours per week",
       y = "Number of countries") +
  facet_grid(cols = vars(year))

ggplot(ilo_data) +
  geom_histogram(aes(x = working_hours)) +
  labs(x = "Working hours per week",
       y = "Number of countries") +
  facet_wrap(facets = vars(year))

在 Tidyverse 中用数据进行沟通

分面散点图

在 Tidyverse 中用数据进行沟通

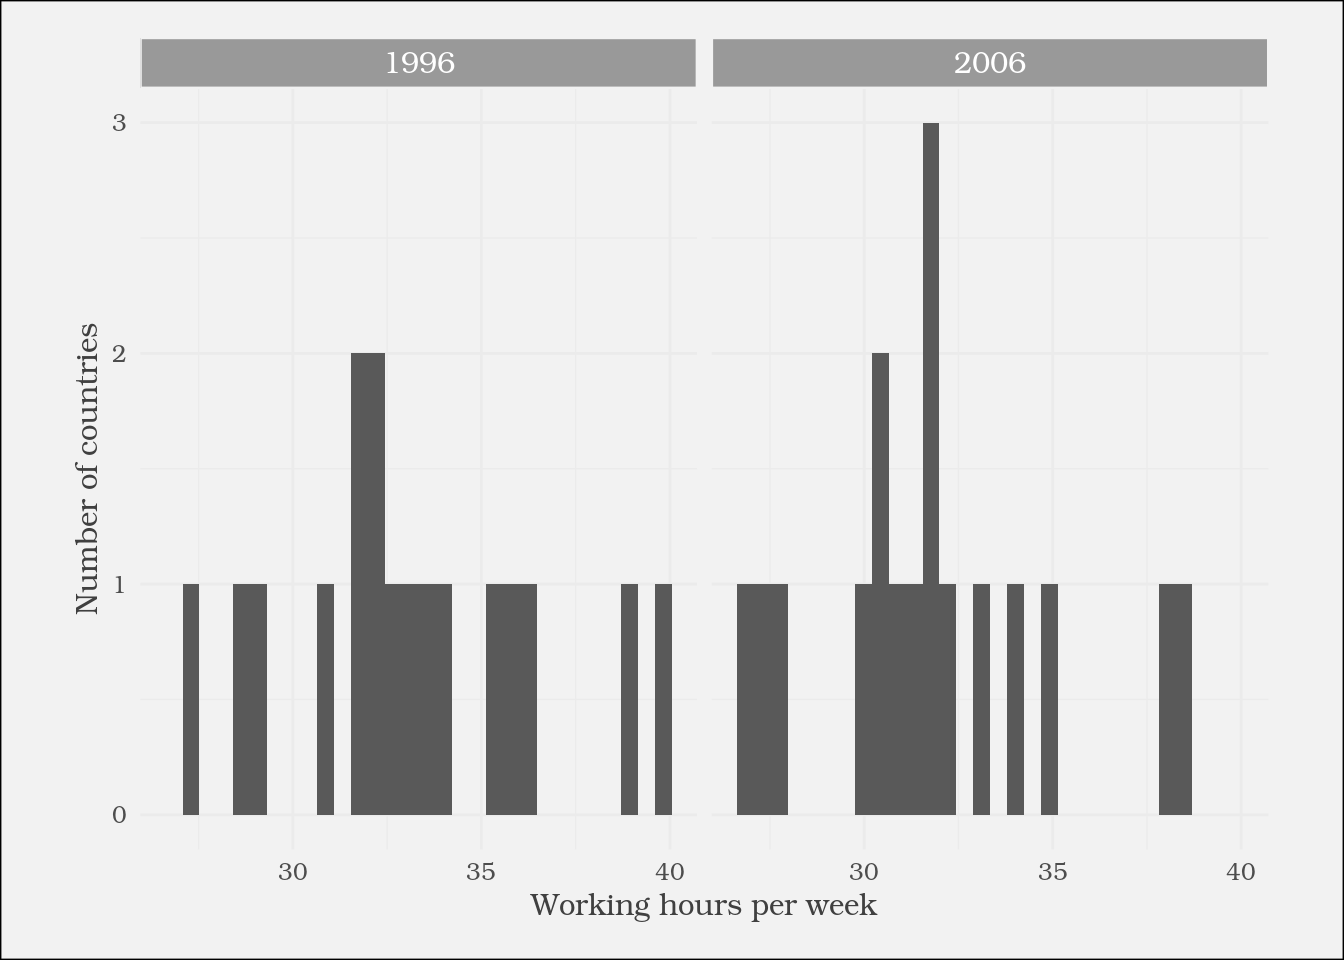
分面图的样式

strip.background
strip.text
...
在 Tidyverse 中用数据进行沟通

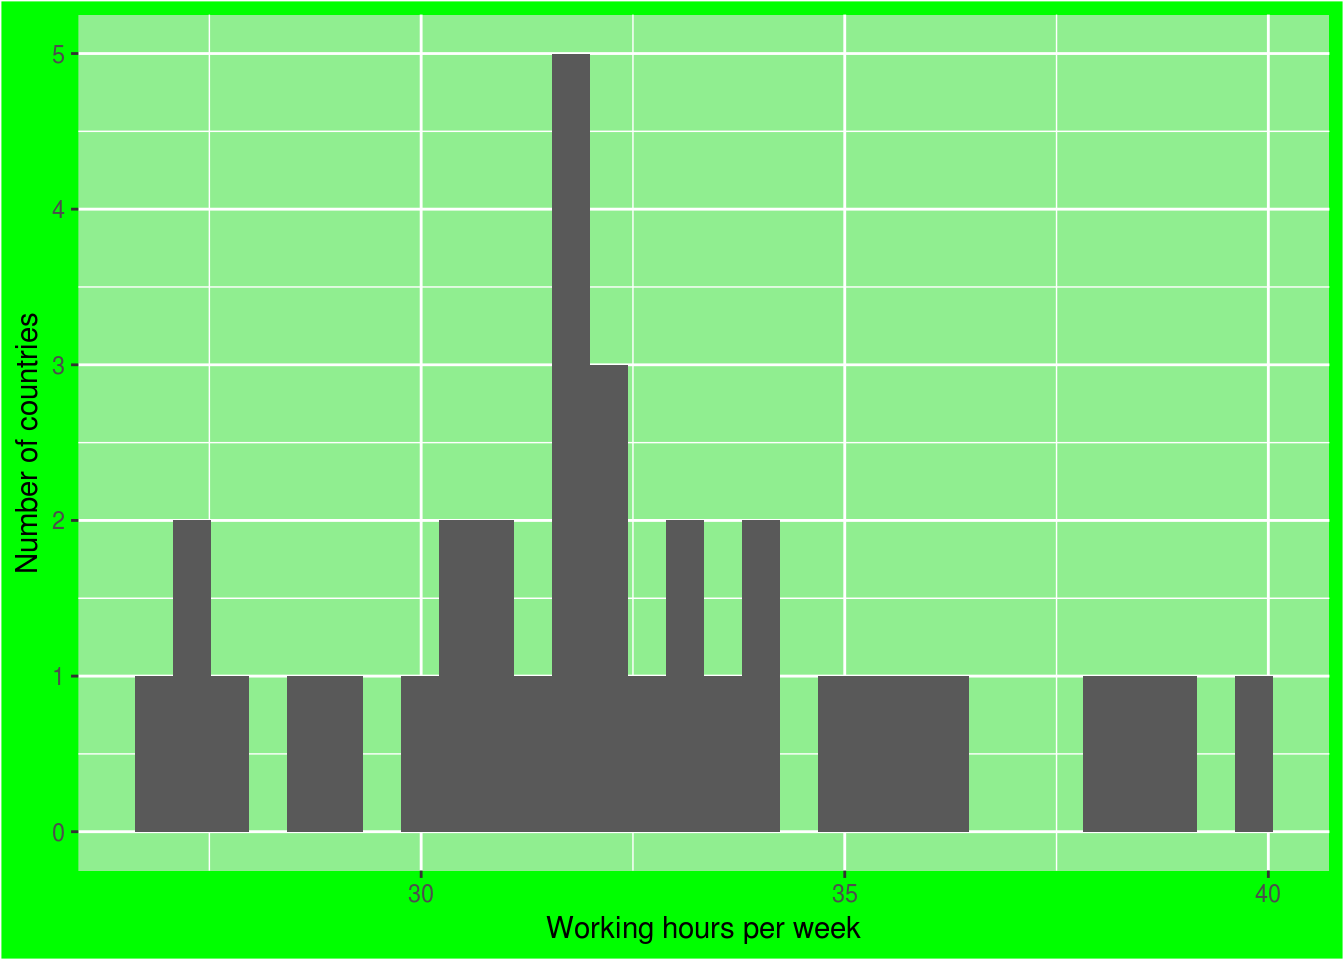
自定义主题函数

theme_green <- function(){
  theme(
    plot.background = 
      element_rect(fill = "green"),
    panel.background = 
      element_rect(fill = 
        "lightgreen")
  )}
ggplot(ilo_data) +
  geom_histogram(aes(
    x = working_hours)) +
  labs(x = "Working hours per week",
       y = "Number of countries") +

theme_green()

在 Tidyverse 中用数据进行沟通

Passons à la pratique !

在 Tidyverse 中用数据进行沟通

Preparing Video For Download...