评估模型拟合
在 R 中使用 tidymodels 建模

David Svancer
Data Scientist
二分类
具有两个水平的结果变量
- 正类
- 关注的待预测事件
purchased变量中的 "yes"
负类
- "no"
在
tidymodels中,结果变量需为因子- 第一个水平为正类
- 用
levels()检查顺序
leads_df
# A tibble: 1,328 x 7
  purchased total_visits  ...   us_location
   <fct>        <dbl>     ...     <fct>
 1 yes            7       ...     west
 2 no             8       ...     west
 3 no             5       ...     southeast
# ... with 1,325 more rows
levels(leads_df[['purchased']])
[1] "yes" "no"
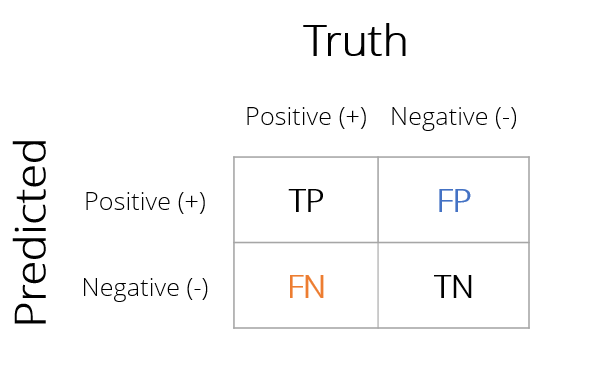
混淆矩阵
统计实际与预测取值所有组合的矩阵
正确预测
- 真阳性(TP)
- 真阴性(TN)
分类错误
- 假阳性(FP)
- 假阴性(FN)
使用 yardstick 的分类指标
用 yardstick 创建混淆矩阵与其他拟合指标
- 需要包含以下内容的模型结果 tibble:
- 真实标签
purchased
- 预测类别
.pred_class
- 各类别的预测概率
.pred_yes.pred_no
- 真实标签
leads_results
# A tibble: 332 x 4
   purchased .pred_class .pred_yes .pred_no
   <fct>     <fct>           <dbl>    <dbl>
 1 no        no             0.134     0.866
 2 yes       yes            0.729     0.271
 3 no        no             0.133     0.867
 4 no        no             0.0916    0.908
 5 yes       yes            0.598     0.402
 6 no        no             0.128     0.872
 7 yes       no             0.112     0.888
 8 no        no             0.169     0.831
 9 no        no             0.158     0.842
10 yes       yes            0.520     0.480
# ... with 322 more rows
使用 yardstick 的混淆矩阵
conf_mat() 函数
- 模型结果的 tibble
truth:真实标签列estimate:预测标签列
对 leads_df 的逻辑回归
- 正确分类 252/332 位客户(76%)
- 46 个假阴性
- 34 个假阳性
conf_mat(leads_results,truth = purchased,estimate = .pred_class)
Truth
Prediction yes no
yes 74 34
no 46 178
分类准确率
accuracy() 函数
- 参数与
conf_mat()相同 - 计算分类准确率
$$\frac{TP + TN}{TP + TN + FP + FN}$$
yardstick函数总是返回 tibble.metric:度量类型.estimate:计算值
accuracy(leads_results,
truth = purchased,
estimate = .pred_class)
# A tibble: 1 x 3
.metric .estimator .estimate
<chr> <chr> <dbl>
1 accuracy binary 0.759
灵敏度
很多情况下,准确率并非最佳指标
leads_df数据- 全部判为"no"也有 64% 准确率
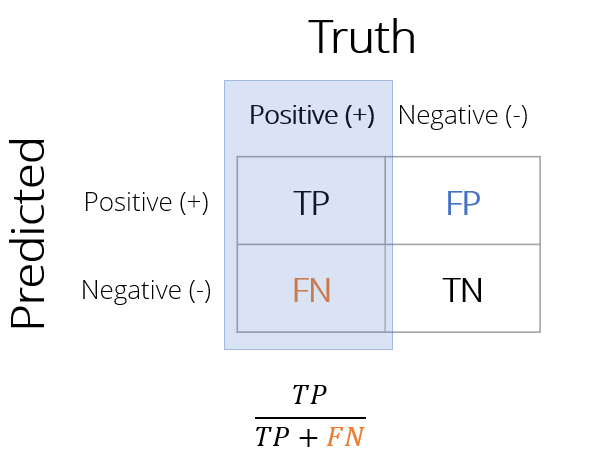
灵敏度(Sensitivity)
在所有正类中被正确分类的比例
- 对于确实购买的客户,模型正确预测的比例是多少?
- 降低假阴性可提高灵敏度
计算灵敏度
sens() 函数
- 参数与
conf_mat()和accuracy()相同 - 在
.estimate列返回灵敏度
sens(leads_results,
truth = purchased,
estimate = .pred_class)
# A tibble: 1 x 3
.metric .estimator .estimate
<chr> <chr> <dbl>
1 sens binary 0.617
特异度
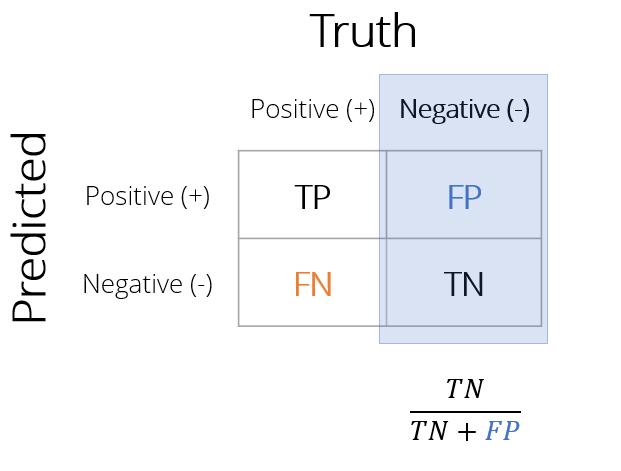
特异度(Specificity):在所有负类中被正确分类的比例
- 对于未购买的客户,模型正确预测的比例是多少?
- 降低假阳性可提高特异度
1 - 特异度
- 亦称为假阳性率(FPR)
- 真负中假阳性的比例
计算特异度
spec() 函数
- 参数与
sens()相同 - 在
.estimate列返回特异度
spec(leads_results,
truth = purchased,
estimate = .pred_class)
# A tibble: 1 x 3
.metric .estimator .estimate
<chr> <chr> <dbl>
1 spec binary 0.840
创建度量集
自定义度量集
metric_set()函数- 用选定的
yardstick指标创建自定义度量函数 - 将
yardstick指标函数名传入metric_set() - 用自定义函数计算指标
- 用选定的
custom_metrics <-
metric_set(accuracy, sens, spec)
custom_metrics(leads_results,
truth = purchased,
estimate = .pred_class)
# A tibble: 3 x 3
.metric .estimator .estimate
<chr> <chr> <dbl>
1 accuracy binary 0.759
2 sens binary 0.617
3 spec binary 0.840
多种指标
二分类指标
二分类指标种类丰富:
accuracy(),kap(),sens(),spec(),ppv(),npv(),mcc(),j_index(),bal_accuracy(),detection_prevalence(),precision(),recall(),f_meas()
将
conf_mat()的结果传给summary()可一次计算
conf_mat(leads_results,

         truth = purchased,

estimate = .pred_class) %>%
summary()
# A tibble: 13 x 3
   .metric              .estimator .estimate
   <chr>                <chr>          <dbl>
 1 accuracy             binary         0.759
 2 kap                  binary         0.466
 3 sens                 binary         0.617
 4 spec                 binary         0.840
 5 ppv                  binary         0.685
 6 npv                  binary         0.795
 7 mcc                  binary         0.468
 8 j_index              binary         0.456
 9 bal_accuracy         binary         0.728
10 detection_prevalence binary         0.325
11 precision            binary         0.685
12 recall               binary         0.617
13 f_meas               binary         0.649
Vamos praticar!
在 R 中使用 tidymodels 建模

