分类模型
在 R 中使用 tidymodels 建模

David Svancer
Data Scientist
预测产品购买
分类模型预测分类结果变量
- 预测产品是否购买
| purchased | total_time | total_visits |
|---|---|---|
| yes | 800 | 3 |
| yes | 978 | 7 |
| no | 220 | 4 |
| no | 124 | 5 |
| yes | 641 | 4 |
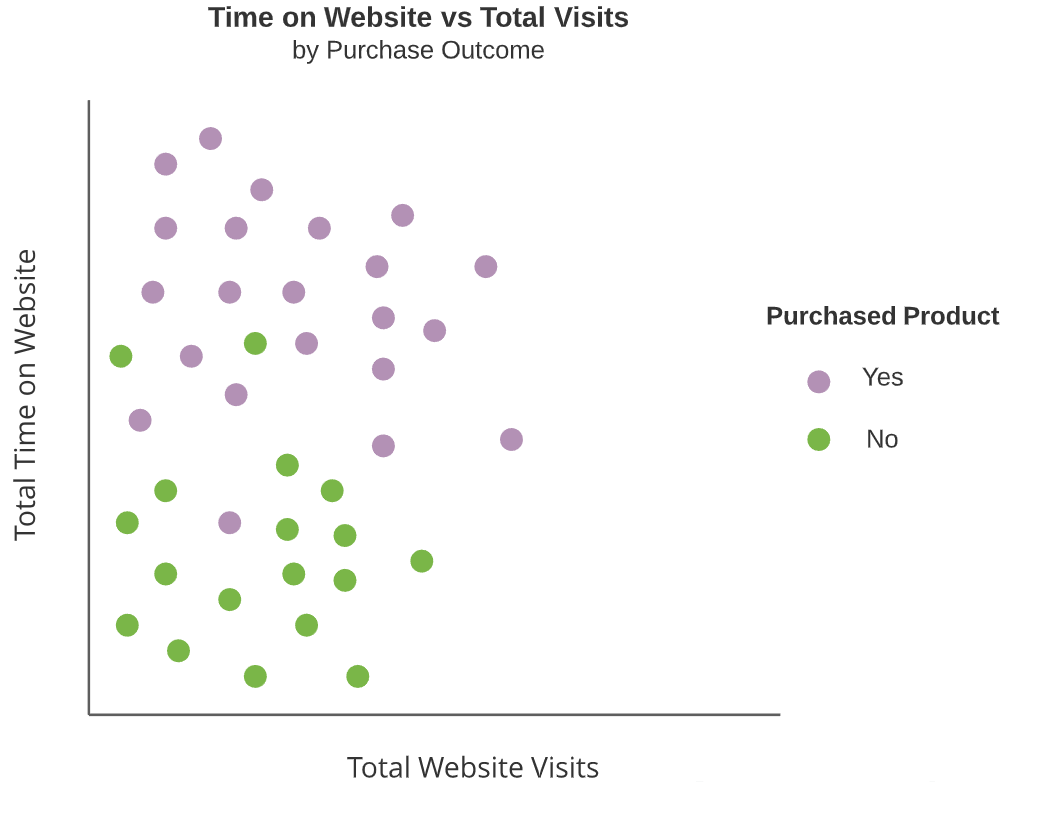
分类算法
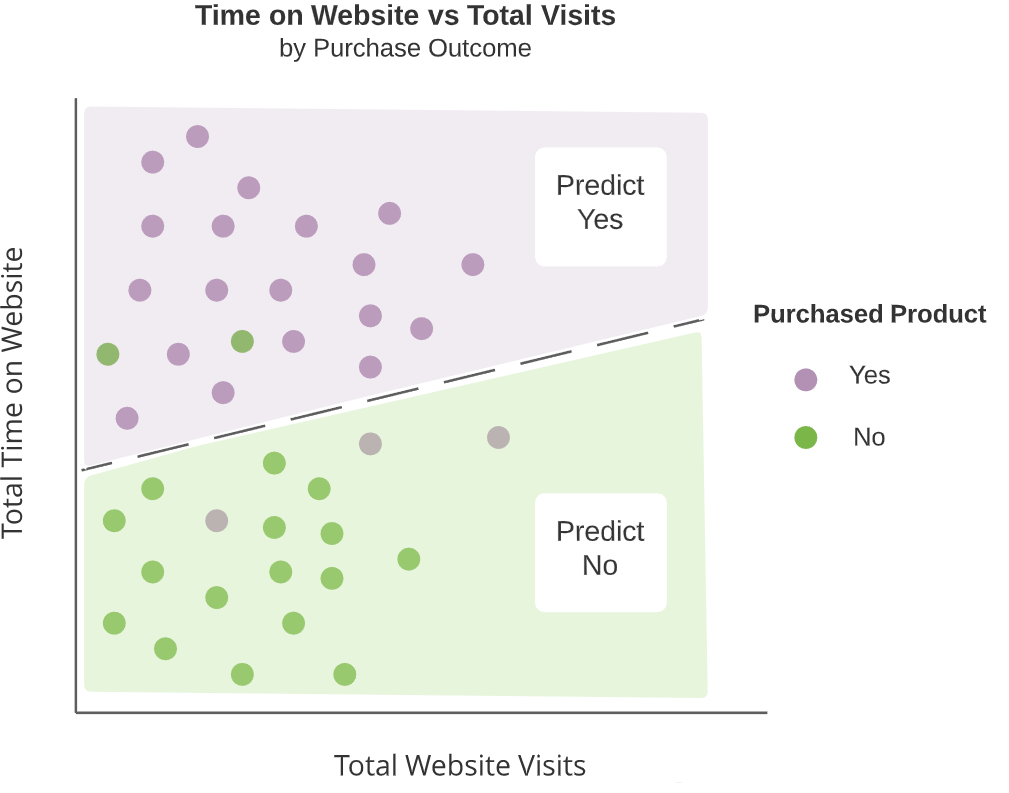
目标:在一组自变量取值上划分彼此不重叠的区域
- 在每个区域预测相同的分类结果
分类算法
目标:在一组自变量取值上划分彼此不重叠的区域
- 在每个区域预测相同的分类结果
逻辑回归
- 常用的分类算法,产生类别间的线性分隔
线索评分数据
leads_df
# A tibble: 1,328 x 7
   purchased total_visits total_time pages_per_visit total_clicks lead_source    us_location
   <fct>            <dbl>      <dbl>           <dbl>        <dbl> <fct>          <fct>
 1 yes                  7       1148            7              59 direct_traffic west
 2 no                   8        100            2.67           24 direct_traffic west
 3 no                   5        228            2.5            25 email          southeast
 4 no                   7        481            2.33           21 organic_search west
 5 no                   4        177            4              37 direct_traffic west
 6 no                   2       1273            2              26 email          midwest
 7 no                   3        711            3              28 organic_search west
 8 no                   3        166            3              32 direct_traffic southeast
 9 no                   3          7            3              23 organic_search west
10 no                   6        562            6              48 organic_search southeast
# ... with 1,318 more rows
数据重采样
拟合模型的第一步
- 使用
initial_split()创建数据切分对象 - 用
training()和testing()生成训练集与测试集
leads_split <- initial_split(leads_df, prop = 0.75, strata = purchased)leads_training <- leads_split %>% training()leads_test <- leads_split %>% testing()
逻辑回归模型规范
parsnip 中的模型规范
logistic_reg()parsnip中逻辑回归的通用接口- 常用引擎:'glm'
- 模式:'classification'
logistic_model <- logistic_reg() %>%set_engine('glm') %>%set_mode('classification')
模型训练
指定模型后,用 fit() 进行训练
- 将模型对象传给
fit() - 指定模型公式
- 提供训练数据,参数
data
logistic_fit <- logistic_model %>%fit(purchased ~ total_visits + total_time,data = leads_training)
预测结果类别
predict() 函数
new_data指定要预测的新数据集type'class'返回分类预测
predict() 的标准化输出
- 返回 tibble
- 当
type为'class'时,返回名为.pred_class的因子列
class_preds <- logistic_fit %>%predict(new_data = leads_test,type = 'class')class_preds
# A tibble: 332 x 1
   .pred_class
   <fct>
 1 no
 2 yes
 3 no
 4 no
 5 yes
 # ... with 327 more rows
估计概率
将 type 设为 'prob' 可返回各类别的估计概率
predict() 将返回含多列的 tibble
- 每个结果类别一列
- 列名规则:
.pred_{outcome_category}
prob_preds <- logistic_fit %>%
  predict(new_data = leads_test,
          type = 'prob')

prob_preds
# A tibble: 332 x 2
   .pred_yes .pred_no
       <dbl>    <dbl>
 1    0.134     0.866
 2    0.729     0.271
 3    0.133     0.867
 4    0.0916    0.908
 5    0.598     0.402
# ... with 327 more rows
合并结果
使用 yardstick 评估模型需要结果 tibble
可用 bind_cols() 合并测试集中的结果变量与预测 tibbles
leads_results <- leads_test %>%
  select(purchased) %>%
  bind_cols(class_preds, prob_preds)
leads_results
# A tibble: 332 x 4
   purchased .pred_class .pred_yes .pred_no
   <fct>     <fct>           <dbl>    <dbl>
 1 no        no             0.134     0.866
 2 yes       yes            0.729     0.271
 3 no        no             0.133     0.867
 4 no        no             0.0916    0.908
 5 yes       yes            0.598     0.402
# ... with 327 more rows
电信数据
telecom_df
# A tibble: 975 x 9
   canceled_service cellular_service avg_data_gb avg_call_mins avg_intl_mins internet_service   contract    months_with_company monthly_charges
   <fct>            <fct>               <dbl>         <dbl>        <dbl>         <fct>           <fct>               <dbl>           <dbl>
 1 yes              single_line         7.78           497         127         fiber_optic     month_to_month         7              76.4
 2 yes              single_line         9.04           336         88          fiber_optic     month_to_month         10             94.9
 3 no               single_line         10.3           262         55          fiber_optic     one_year               50             103.
 4 yes              multiple_lines      5.08           250         107         digital         one_year               53             60.0
 5 no               multiple_lines      8.05           328         122         digital         two_year               50             75.2
 6 no               single_line         9.3            326         114         fiber_optic     month_to_month         25             95.7
 7 yes              multiple_lines      8.01           525         97          fiber_optic     month_to_month         19             83.6
 8 no               multiple_lines      9.4            312         147         fiber_optic     one_year               50             99.4
 9 yes              single_line         5.29           417         96          digital         month_to_month         8              49.8
10 no               multiple_lines      9.96           340         136         fiber_optic     month_to_month         61             106.
# ... with 965 more rows
Passons à la pratique !
在 R 中使用 tidymodels 建模

