营销分析:用 Python 预测客户流失
Mark Peterson
Director of Data Science, Infoblox
seaborn 库可轻松创建信息丰富且美观的图表
seaborn
构建于 matplotlib 之上
matplotlib
import matplotlib.pyplot as plt
import seaborn as sns

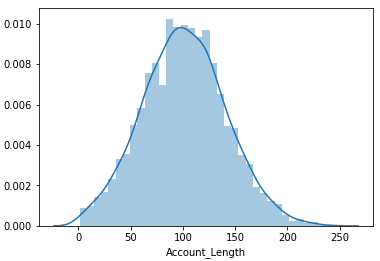
sns.distplot(telco['Account_Length'])

plt.show()
import matplotlib.pyplot as plt import seaborn as sns
sns.distplot(telco['Account_Length'])
plt.show()
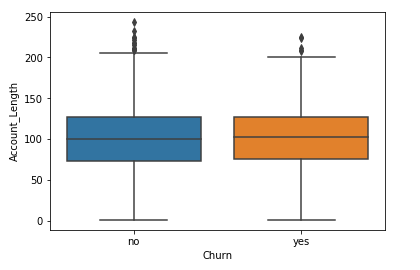
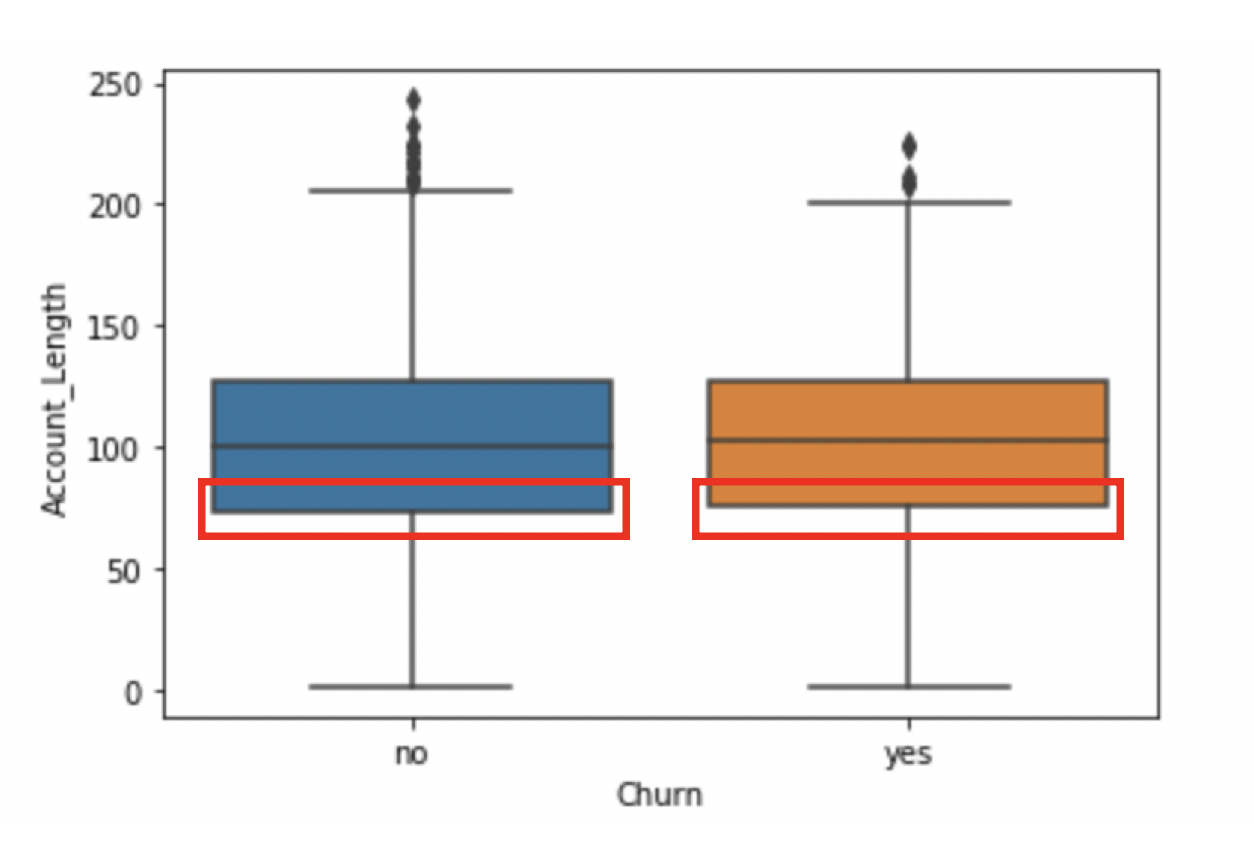
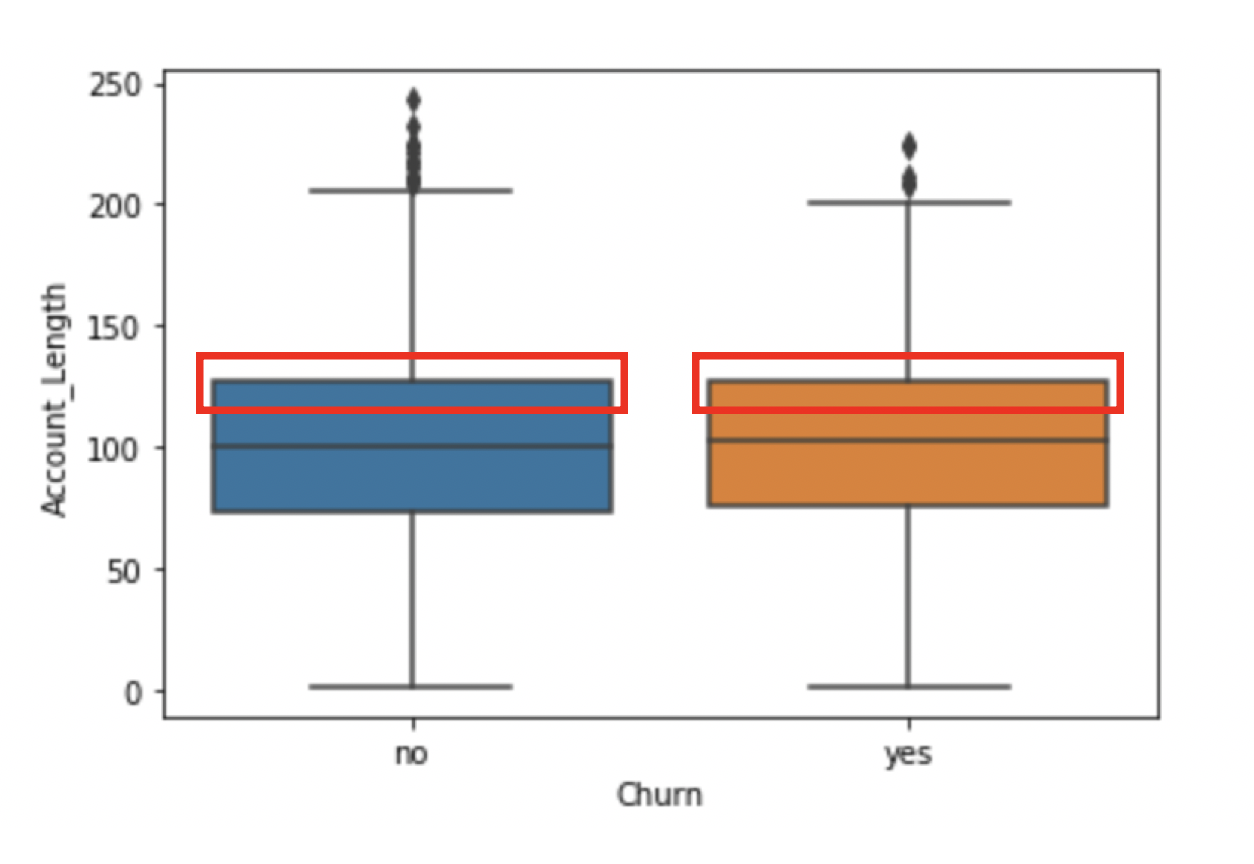
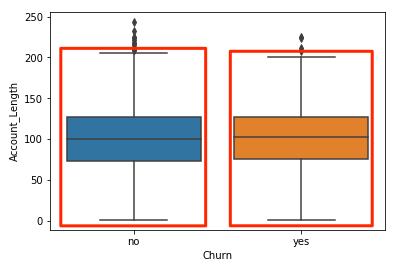
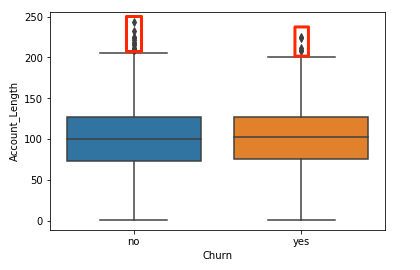
sns.boxplot(x = 'Churn',
            y = 'Account_Length',
            data = telco)

plt.show()
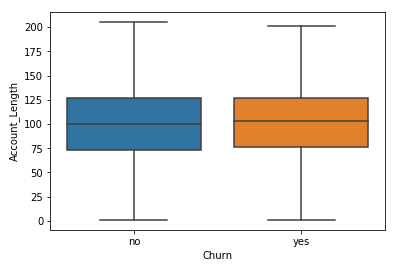
sns.boxplot(x = 'Churn',
            y = 'Account_Length',
            data = telco,
            sym="")

plt.show()
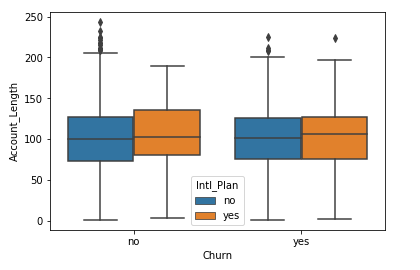
sns.boxplot(x = 'Churn',
            y = 'Account_Length',
            data = telco,
            hue = 'Intl_Plan')

plt.show()