散点图

Python 中的购物篮分析

Isaiah Hull

Visiting Associate Professor of Finance, BI Norwegian Business School

散点图简介
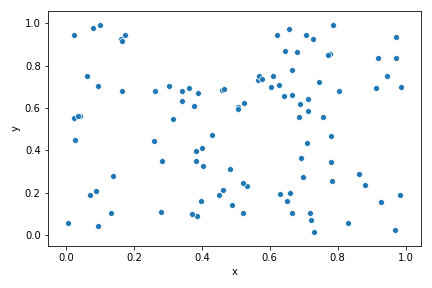
该图展示了一个散点图示例。

Python 中的购物篮分析

散点图简介

  • 散点图展示成对数值。
    • 先导项与后继项的支持度。
    • 置信度与提升度。
  • 不假设模型。
    • 无需趋势线或曲线。
  • 可作为剪枝起点。
    • 识别数据与规则中的模式。
Python 中的购物篮分析

支持度 vs. 置信度

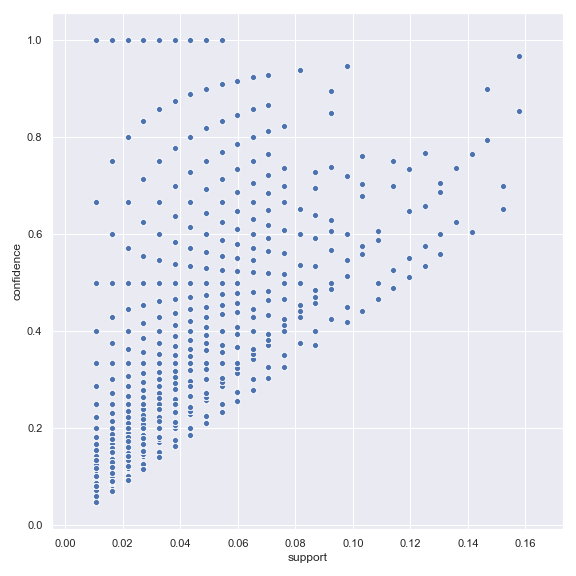
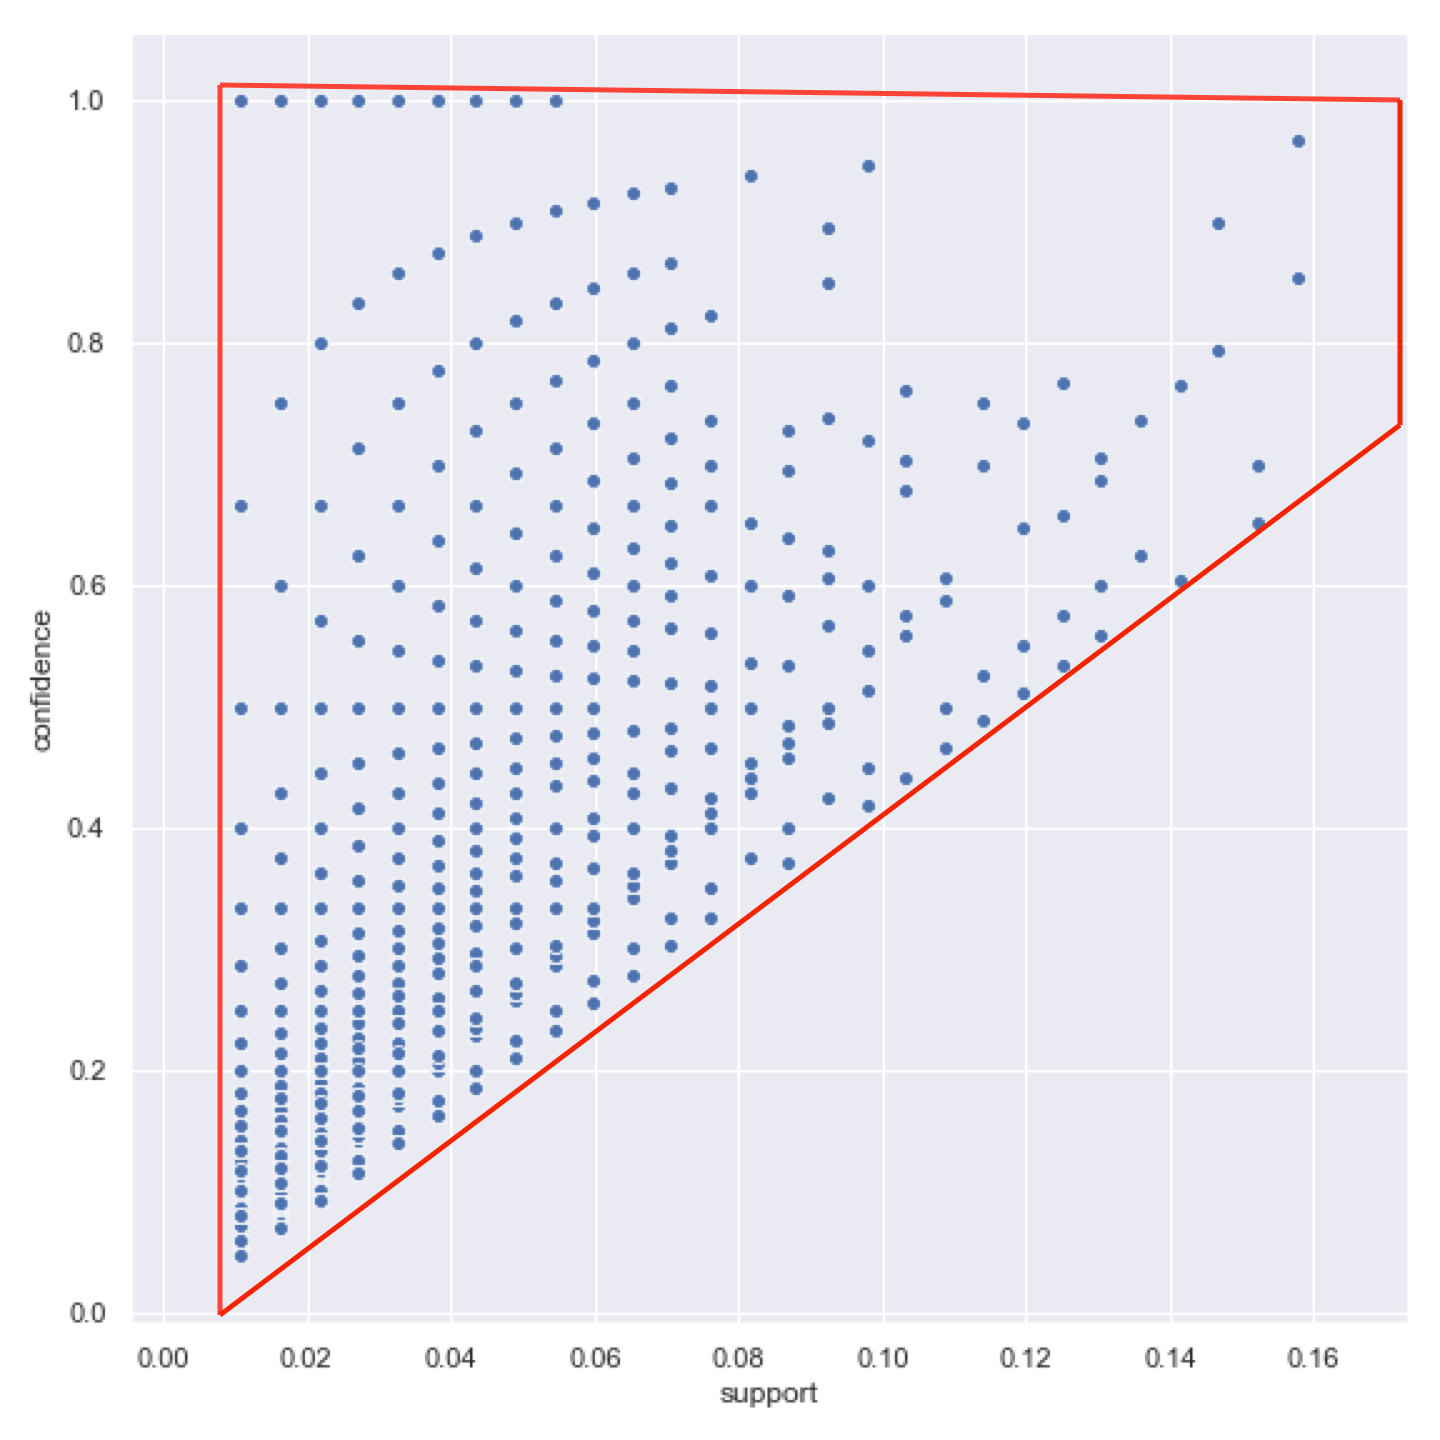
此图展示了在 MovieLens 数据集上生成的规则中,支持度与置信度的散点图。

Python 中的购物篮分析

支持度 vs. 置信度

此图展示了在 MovieLens 数据集上生成的规则中,支持度与置信度的散点图。

1 Bayardo Jr., R.J. and Agrawal, R. (1999). Mining the Most Interesting Rules. In Proceedings of the Fifth ACM SIGKDD International Conference on Knowledge Discovery and Data Mining (pp. 145-154).
Python 中的购物篮分析

绘制散点图

import pandas as pd
import seaborn as sns
from mlxtend.frequent_patterns import association_rules, apriori

# Load one-hot encoded MovieLens data
onehot = pd.read_csv('datasets/movies_onehot.csv')
# Generate frequent itemsets using Apriori
frequent_itemsets = apriori(onehot, min_support=0.01, use_colnames=True, max_len=2)

# Generate association rules
rules = association_rules(frequent_itemsets, metric='support', min_threshold=0.0)
sns.scatterplot(x="antecedent support", y="consequent support", data=rules)
Python 中的购物篮分析

绘制散点图

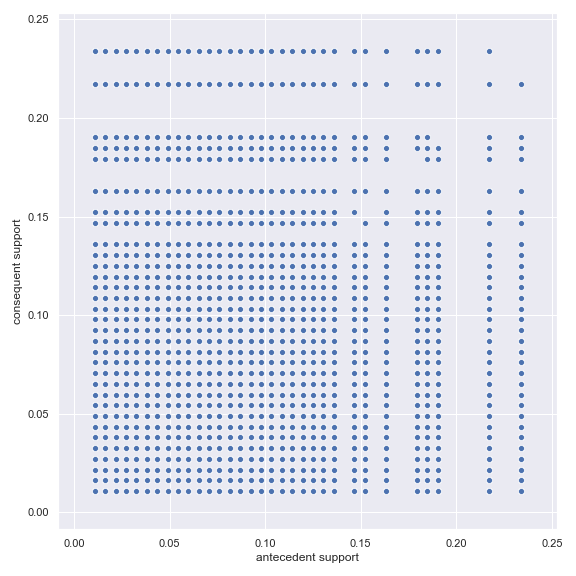
该图展示了先导项支持度与后继项支持度的散点图。

Python 中的购物篮分析

加入第三个指标


sns.scatterplot(x="antecedent support", 
                y="consequent support", 
                size="lift", 
                data=rules)
Python 中的购物篮分析

加入第三个指标

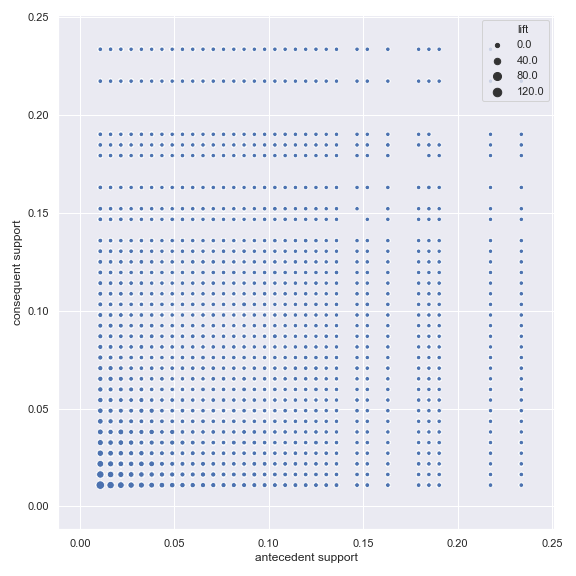
该散点图展示了先导项支持度、后继项支持度与提升度的关系。

Python 中的购物篮分析

散点图能带来什么启发?

  • 识别数据中的自然阈值。
    • 热图等无法做到。
  • 可视化整个数据集。
    • 不限于少量规则。
  • 据此进行剪枝。
    • 利用自然阈值与模式剪枝。
Python 中的购物篮分析

Vamos praticar!

Python 中的购物篮分析

Preparing Video For Download...