模型误差与随机性

Python 线性建模入门

Jason Vestuto

Data Scientist

误差类型

  1. 测量误差
    • 例如:传感器损坏、记录错误
  2. 抽样偏差
    • 例如:只取最炎热的八月温度
  3. 随机因素
Python 线性建模入门

原假设

问题:我们的效应来自真实关系,还是纯属随机?

答案:检验原假设。

Python 线性建模入门

有序数据

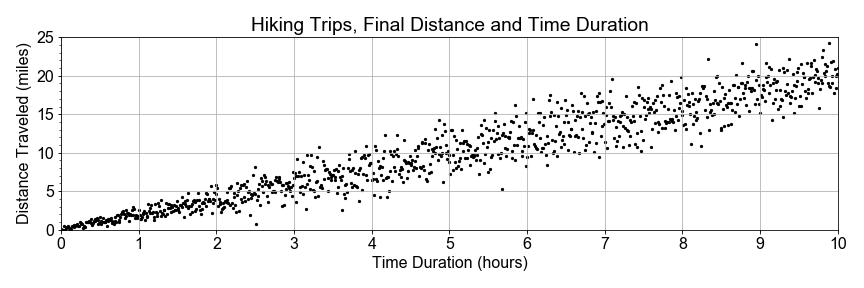
徒步数据的散点图:横轴时间(小时),纵轴距离(英里)

Python 线性建模入门

分组数据

徒步数据的散点图:横轴时间(小时),纵轴距离(英里);<5 小时为红色,>5 小时为蓝色

Python 线性建模入门

分组数据

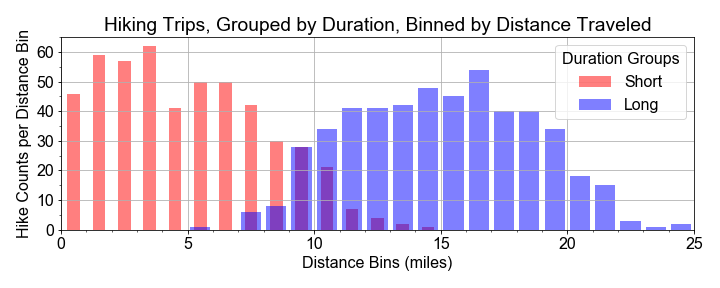
两组近似钟形的直方图:短时组(红)均值约 5 英里,长时组(蓝)均值约 15 英里

  • 短时组,均值 = 5
  • 长时组,均值 = 15
Python 线性建模入门

检验统计量

# Group into early and late times
group_short = sample_distances[times < 5]
group_long = sample_distances[times > 5]
# Resample distributions
resample_short = np.random.choice(group_short, size=500, replace=True)
resample_long = np.random.choice(group_long, size=500, replace=True)
# Test Statistic
test_statistic = resample_long - resample_short
# Effect size as mean of test statistic distribution
effect_size = np.mean(test_statistic)
Python 线性建模入门

打乱与重分组

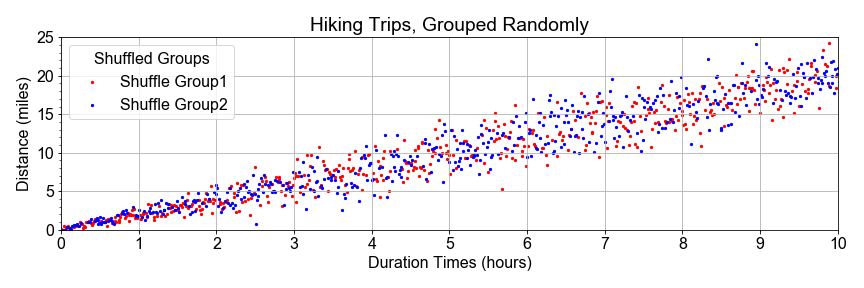
徒步数据的散点图:横轴为行程时间(小时),纵轴为行走距离(英里);红色与蓝色在各时间段中交错分布

Python 线性建模入门

打乱与重分组

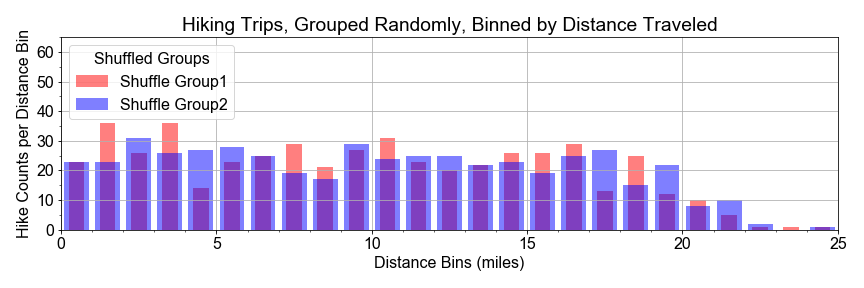
两条几乎完全重合的直方图,范围 0–25 英里,形状相近

Python 线性建模入门

打乱并切分

# Concatenate and Shuffle
shuffle_bucket = np.concatenate((group_short, group_long))
np.random.shuffle(shuffle_bucket)
# Split in the middle
slice_index = len(shuffle_bucket)//2
shuffled_half1 = shuffle_bucket[0:slice_index]
shuffled_half2 = shuffle_bucket[slice_index+1:]
Python 线性建模入门

重采样并再次检验

# Resample shuffled populations
shuffled_sample1 = np.random.choice(shuffled_half1, size=500, replace=True)
shuffled_sample2 = np.random.choice(shuffled_half2, size=500, replace=True)
# Recompute effect size
shuffled_test_statistic = shuffled_sample2 - shuffled_sample1
effect_size = np.mean(shuffled_test_statistic)
Python 线性建模入门

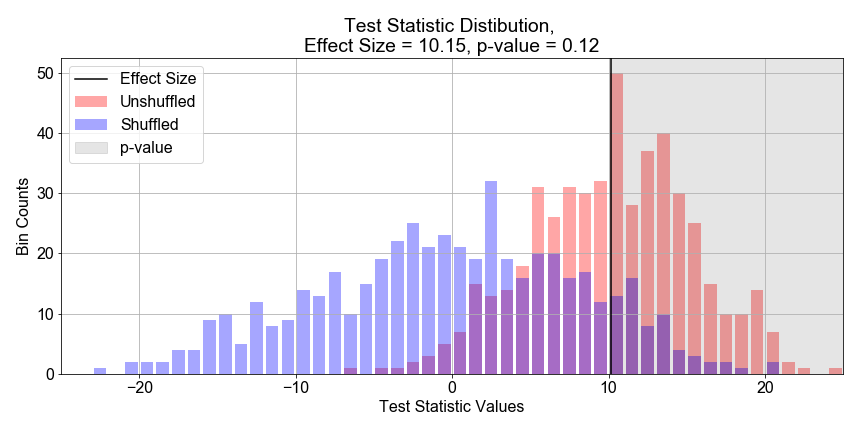
p 值

直方图计数对检验统计量的分布:蓝色直方图以 x=0 为中心且更分散,红色直方图以 x=10 为中心且更窄,x=10 处有一条黑色竖线

Python 线性建模入门

让我们练习!

Python 线性建模入门

Preparing Video For Download...