单变量漂移检测

Python 中的机器学习监控

Hakim Elakhrass

CEO and co-founder

什么是单变量漂移检测?
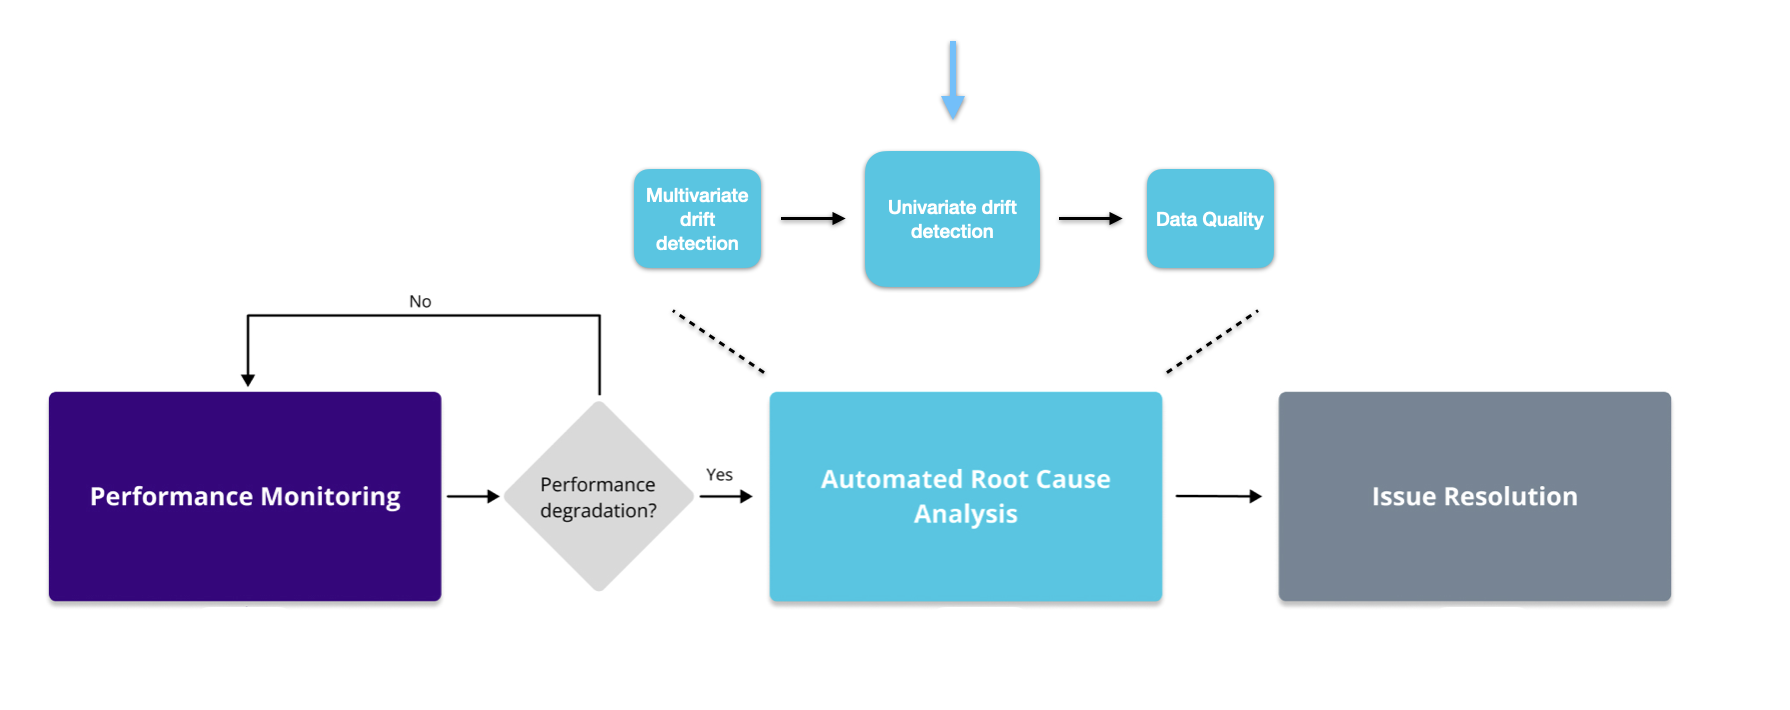
图示为监控工作流以及单变量方法所在位置。

Python 中的机器学习监控

单变量方法

  • Jensen–Shannon 距离——分类与连续
  • Hellinger——分类与连续
  • Wasserstein——仅连续
  • Kolmogorov–Smirnov——仅连续

  • L-infinity——仅分类

  • 卡方(Chi2)——仅分类

1 https://nannyml.readthedocs.io/en/stable/how_it_works/univariate_drift_comparison.html
Python 中的机器学习监控

代码实现

# Intialize the univariate drift calculator
uv_calc = nannyml.UnivariateDriftCalculator(
    continuous_methods=['wasserstein', 'hellinger'],
    categorical_methods=['jensen_shannon', 'l_infinity', 'chi2'],
    column_names=feature_column_names,
    timestamp_column_name='timestamp',
    chunk_period='d'
    )
# Fit, calculate and plot the results
uv_calc.fit(reference)
uv_results = uv_calc.calculate(analysis)
uv_results.plot().show()
Python 中的机器学习监控

筛选

  • 基于列名
  • 基于单变量方法
# Filter the univariate results
filtered_figure = uv_results.filter(column_names=['trip_distance', 'fare_amount'], 
            methods=['jensen_shannon'])

# Plot the filtered results
filtered_figure.show().plot()
Python 中的机器学习监控

警报计数排序器

  • 按警报数量为特征排序
# Initialize the alert count ranker
alert_count_ranker = nannyml.AlertCountRanker()
alert_count_ranked_results = alert_count_ranker.rank(
    uv_results,
    only_drifting=False)
# Display the results
display(alert_count_ranked_results)
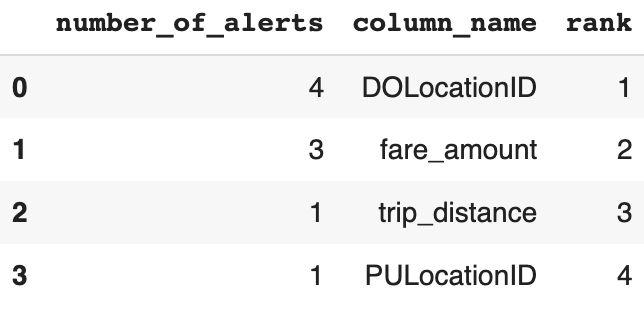
图示为数据框,显示各特征的警报次数。

Python 中的机器学习监控

相关性排序器

  • 按与性能绝对变化的相关性为特征排序
# Initialize the correlation ranker
correlation_ranker = nannyml.CorrelationRanker()
correlation_ranker.fit(perf_results.filter(period='reference'))
correlation_ranked_results = correlation_ranker.rank(uv_results, perf_results)

# Display the results
display(correlation_ranked_results)
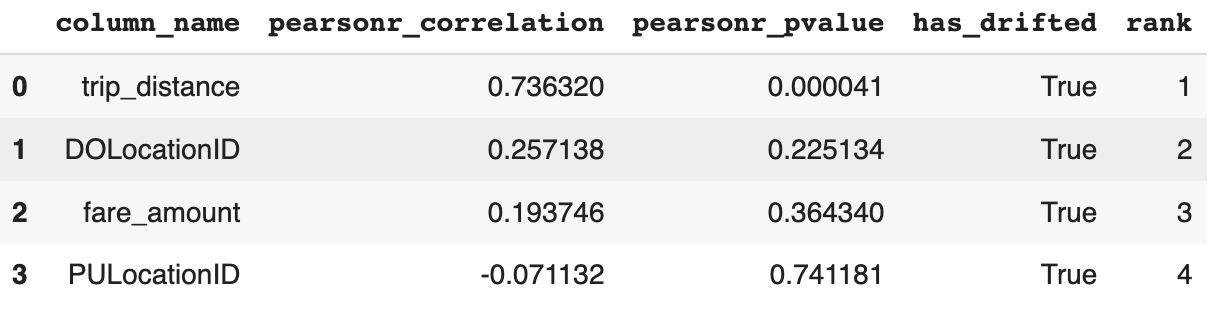
图示为数据框,显示每个特征的皮尔逊相关系数与 p 值。

Python 中的机器学习监控

监控特征分布

  • 提供更好的洞察,提升可解释性
# Create distribution plots
distribution_results = uv_results.plot(kind='distribution')

# Show the plots
distribution_results.show()
Python 中的机器学习监控

特征分布图


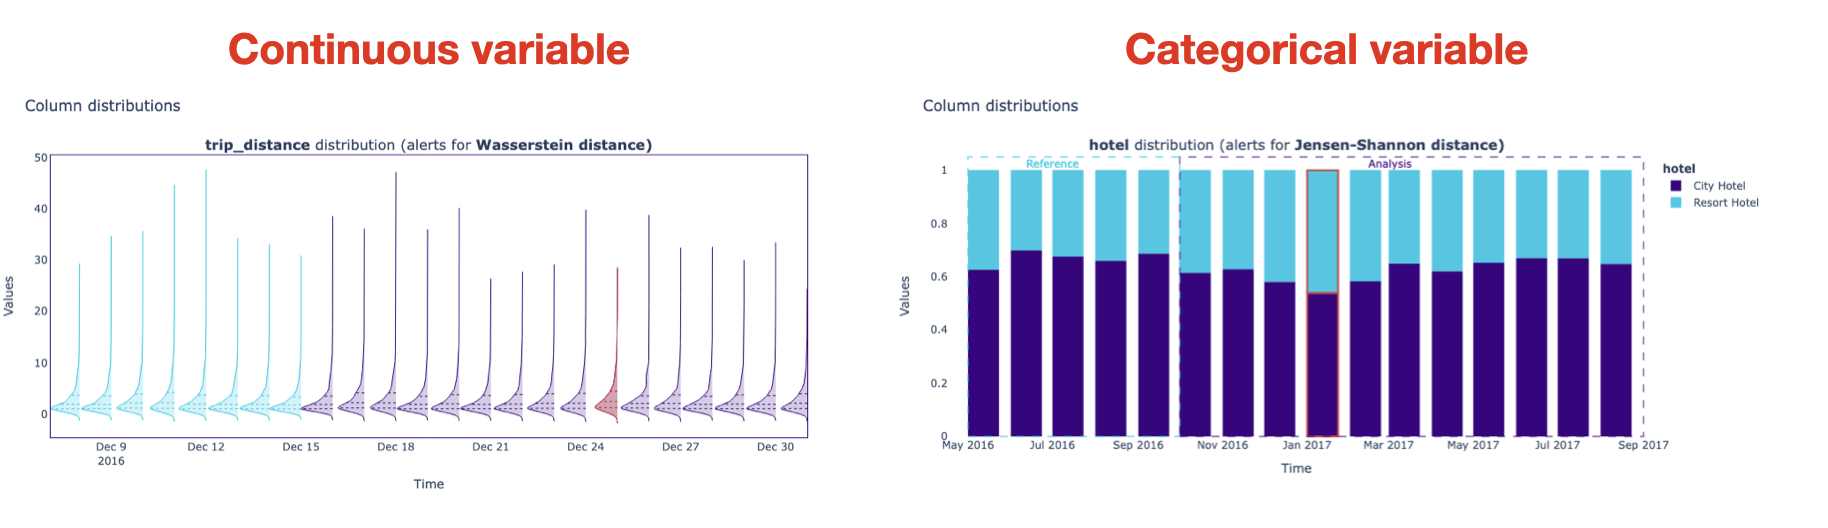
图示为连续型与分类型特征的分布图。

Python 中的机器学习监控

Passons à la pratique !

Python 中的机器学习监控

Preparing Video For Download...