处理计算与估计结果

Python 中的机器学习监控

Maciej Balawejder

Data Scientist

如何对数据分块?
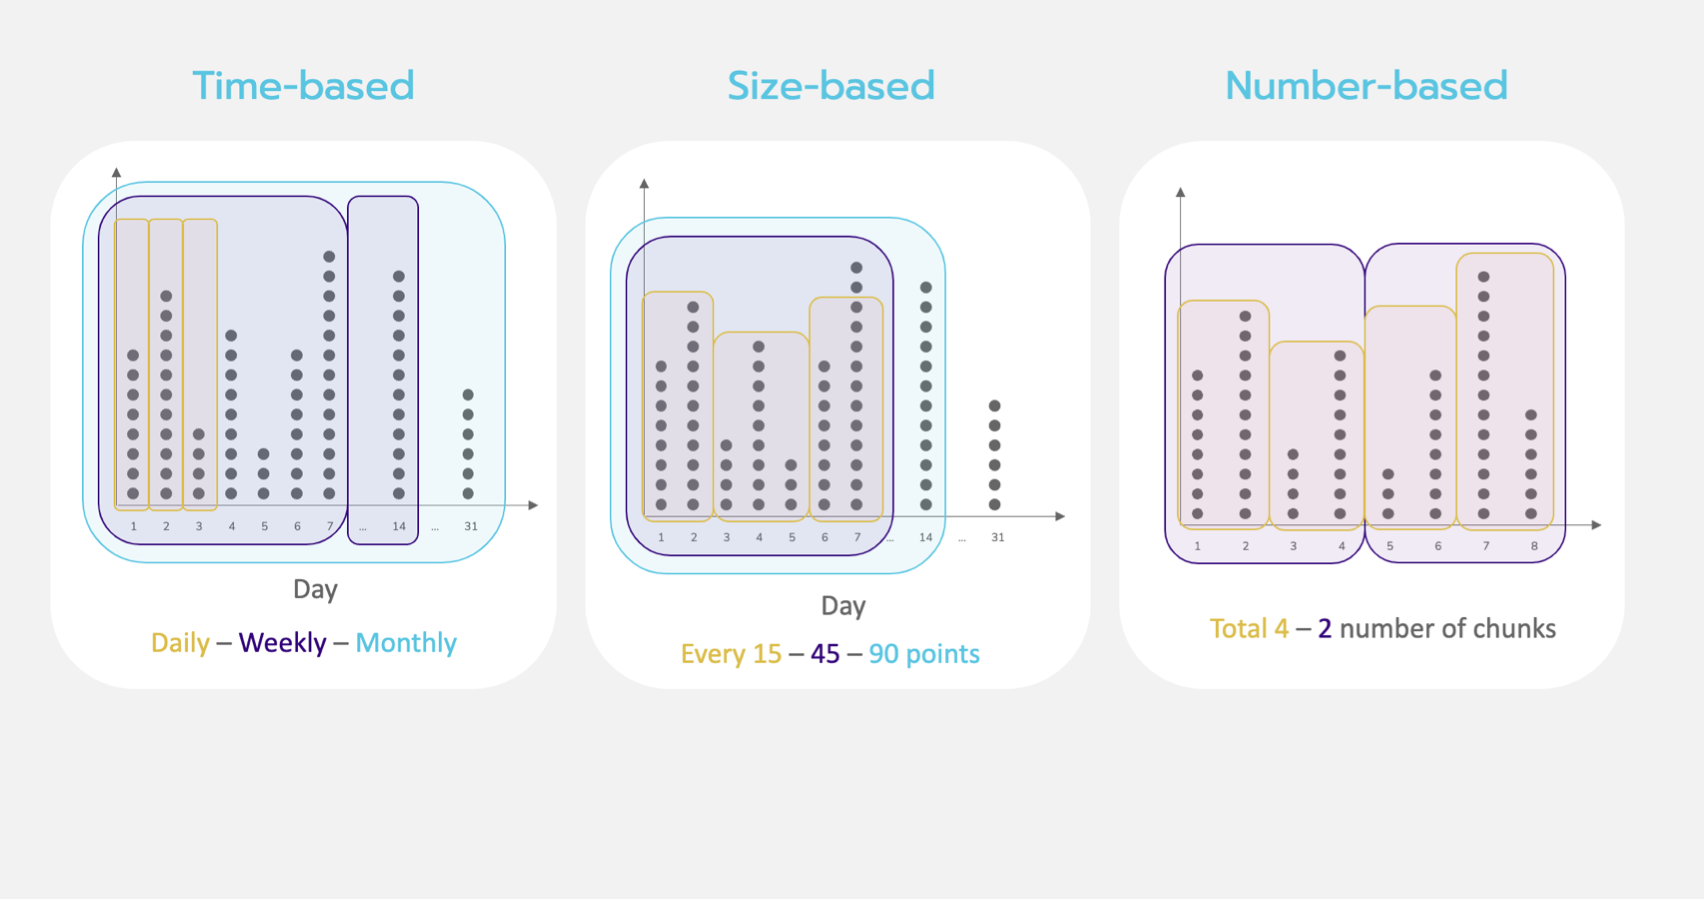
图片显示三种分块方式:按类型、按大小、按数量。

Python 中的机器学习监控

指定不同的分块方式

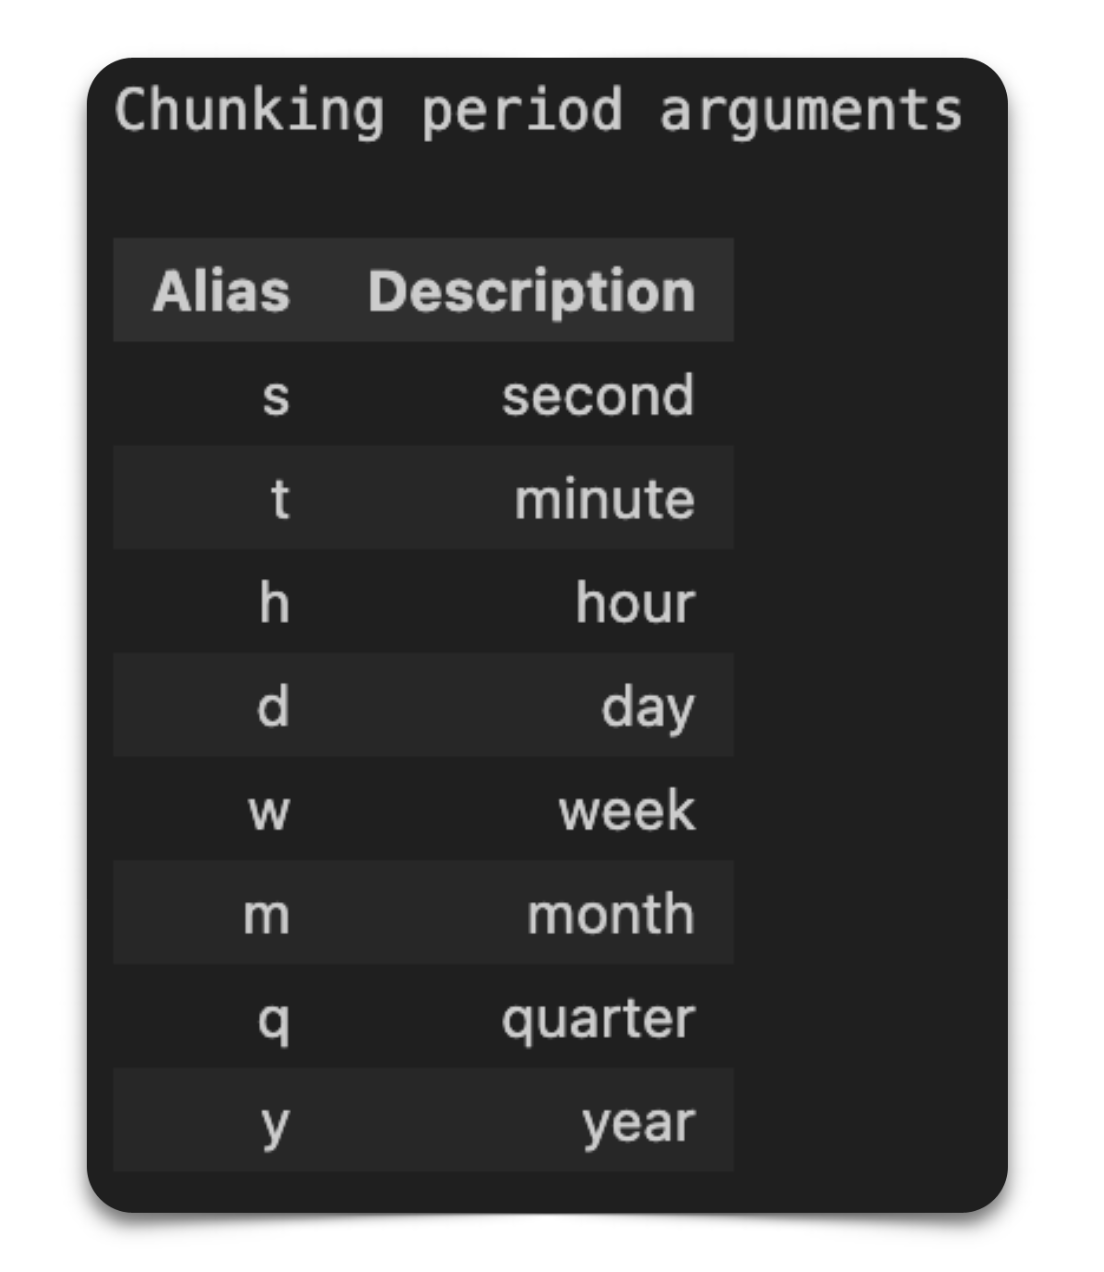
图片展示了可作为 chunk_period 参数传入的基于时间的分块别名。

# 初始化算法
cbpe = nannyml.CBPE(
   problem_type='classification_binary',
   y_pred_proba='predicted_probability',
   y_pred='prediction',
   y_true='employed',
   metrics=['roc_auc'],
   chunk_period='m',
   # chunk_size = 5000, 
   # chunk_number = 10
)
Python 中的机器学习监控

初始化自定义阈值

标准差阈值

  • 手动设置标准差下/上倍数
# 标准差阈值
stdt = StandardDeviationThreshold(
    std_lower_multiplier=3, 
    std_upper_multiplier=3
    )

常量阈值

  • 手动设置下限与上限值
# 常量阈值
ct = ConstantThreshold(
    lower=0.85, 
    upper=0.95
    )
Python 中的机器学习监控

指定自定义阈值

# 导入阈值方法(上一页)
from nannyml.thresholds import ConstantThreshold, StandardDeviationThreshold

# 将阈值传入 CBPE 算法
estimator = nannyml.CBPE(...
    metrics = ['roc_auc', 'accuracy'],
    thresholds={'roc_auc': ct, 'accuracy' : stdt}
)

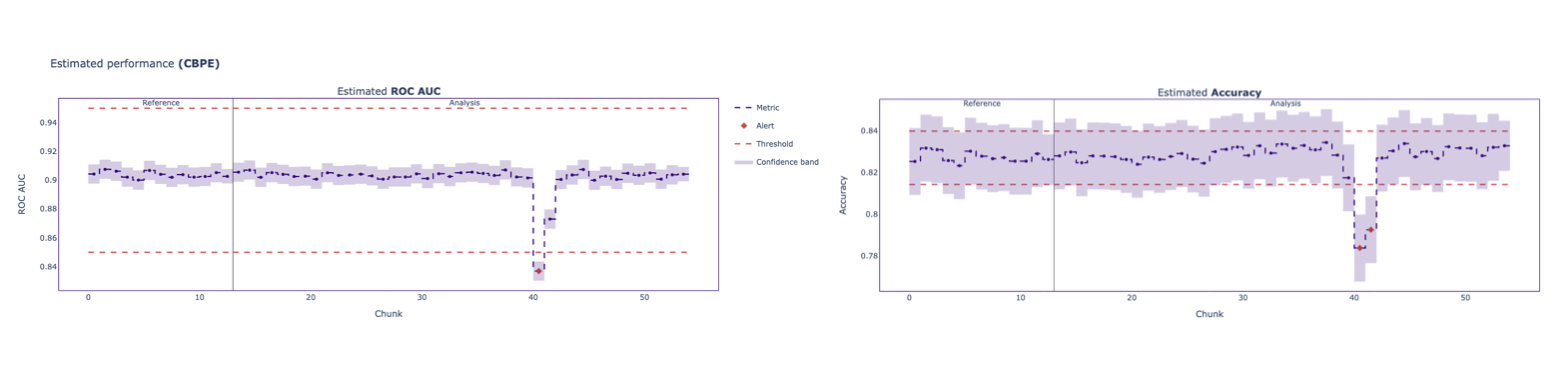
图片显示在自定义阈值下 ROC AUC 与准确率的估计性能图。

Python 中的机器学习监控

筛选结果

  • 按周期
    filtered_results = results.filter(period='analysis')
    
  • 按指标

    filtered_results = results.filter(metrics=['mae'])
    
  • 同时按二者

    filtered_results = results.filter(period='analysis', metrics=['mae'])
    
Python 中的机器学习监控

导出结果为 DataFrame

# 导出为 DataFrame 格式
results.filter(period='analysis').to_df()

图片显示了 DataFrame 格式的结果。

Python 中的机器学习监控

Passons à la pratique !

Python 中的机器学习监控

Preparing Video For Download...