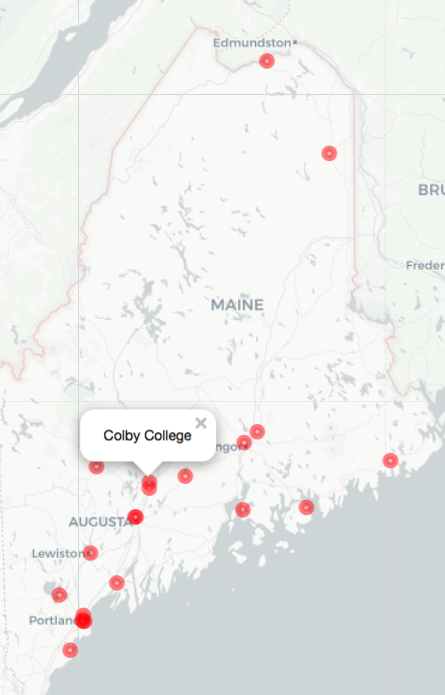
绘制州内高校分布
在 R 中使用 leaflet 构建交互式地图

Rich Majerus
Vice President of Strategy & Planning, Queens University of Charlotte
绘制州内高校分布
# Assuming 'lng' and 'lat' are longitude and latitude, respectively
maine_colleges_map <-
  leaflet() %>%
  addProviderTiles("CartoDB") %>%
  addMarkers(data = maine_colleges)
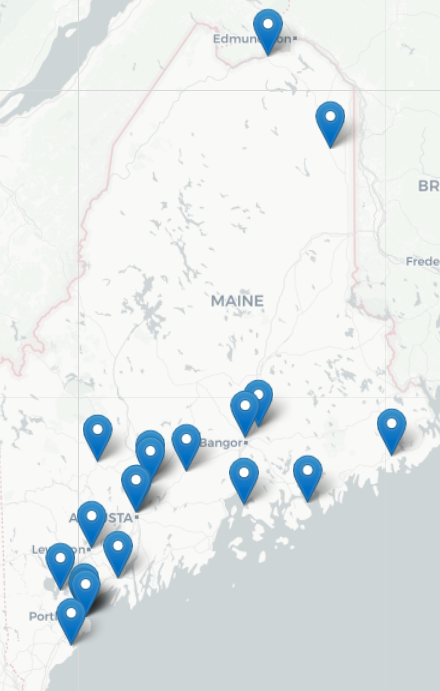
绘制州内高校分布
maine_colleges_map <-
   leaflet() %>%
   addProviderTiles("CartoDB")%>%
   addMarkers(data = maine)
# adding more markers will
# not remove existing markers
maine_colleges_map %>%
   addCircleMarkers(data = maine)
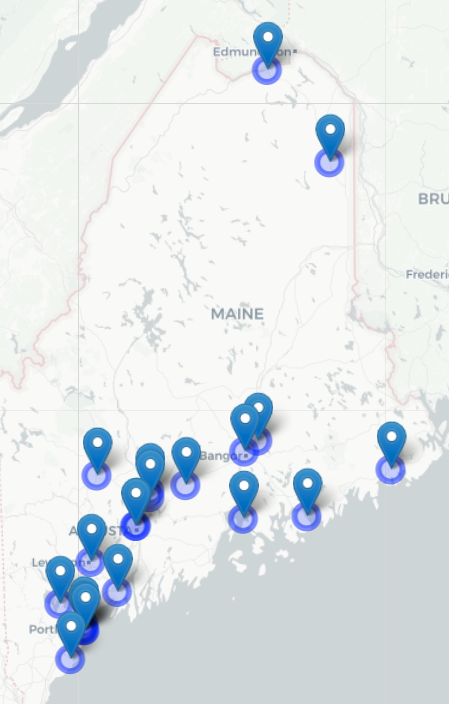
绘制州内高校分布
# adding more markers will
# not remove existing markers
maine_colleges_map %>%
   addCircleMarkers(data = maine)
maine_colleges_map %>%
   clearMarkers() %>%
   addCircleMarkers(data = maine,
                    radius = 3)
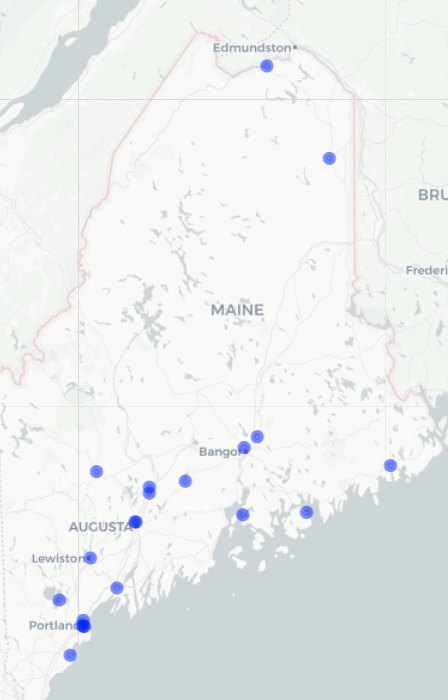
绘制州内高校分布
maine_colleges_map <-
  maine_colleges_map %>%
  clearMarkers %>%
  addCircleMarkers(
          data = maine_colleges,
          radius = 3)
maine_colleges_map %>%
  addCircleMarkers(
           data = maine_colleges,
           radius = 4,
           color = "red",
           popup = ~name)