标签与弹出框
在 R 中使用 leaflet 构建交互式地图

Rich Majerus
Vice President of Strategy & Planning, Queens University of Charlotte
管道与 ~ 运算符
ipeds %>%
 leaflet() %>%
 addProviderTiles("CartoDB") %>%
 addCircleMarkers(
               lng = ~lng,
               lat = ~lat,
               popup = ~name,
               color = "#FF0000")

# ipeds 被指定了 3 次
leaflet() %>%
  addProviderTiles("CartoDB") %>%
  addCircleMarkers(
              lng = ipeds$lng,
              lat = ipeds$lat,
              popup = ipeds$name,
              color = "red")
所有颜色

构建更好的弹出框
addCircleMarkers(popup = ~name)addCircleMarkers(popup = ~paste0(name, "-", sector_label)addCircleMarkers(popup = ~paste0("<b>",name,"</b>"," <br/>",sector_label))

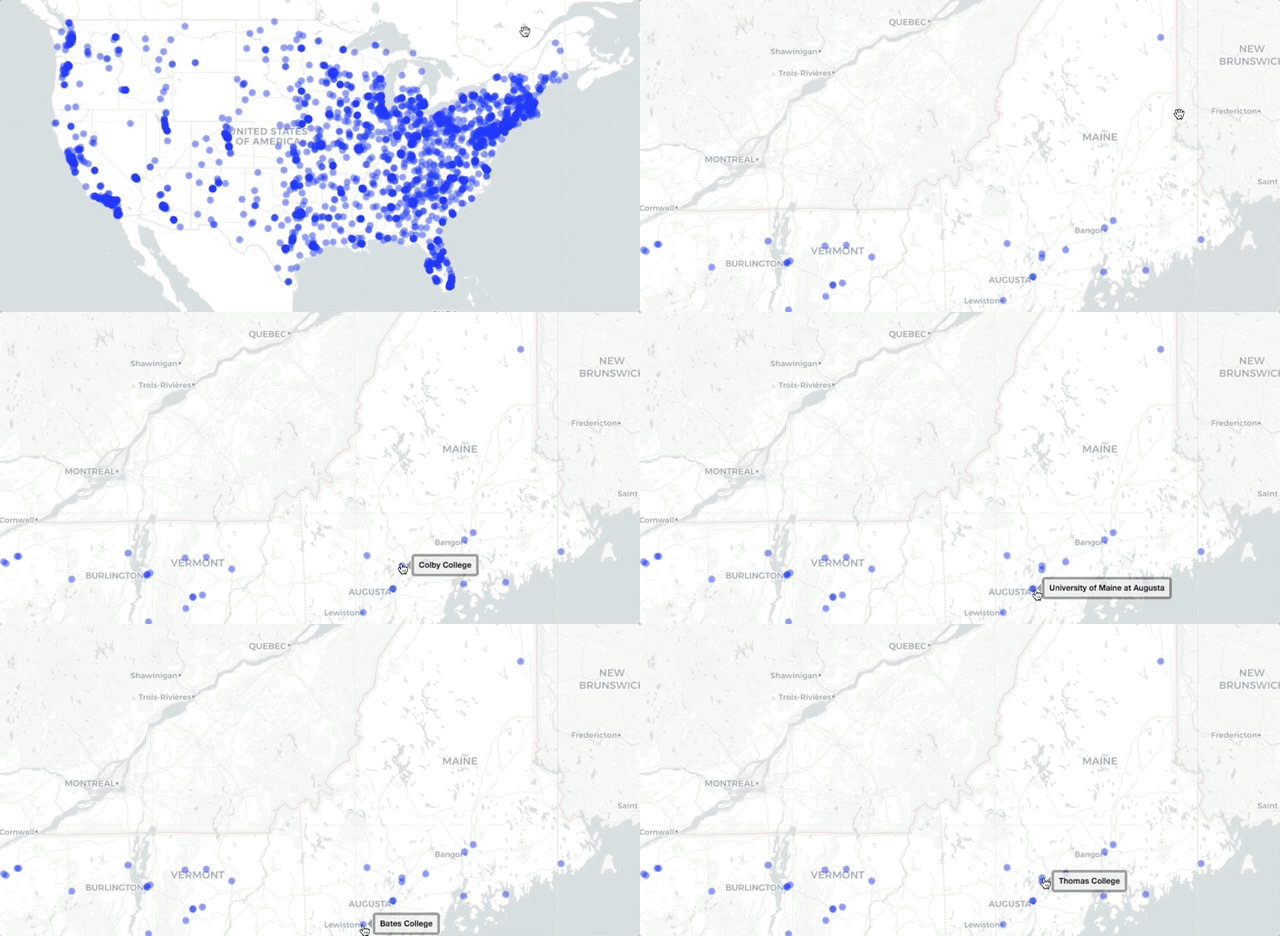
标签
ipeds %>%
    leaflet()  %>%
    addProviderTiles("CartoDB")  %>%
    addCircleMarkers(label = ~name, radius = 2)