Seaborn 简介
Seaborn 数据可视化进阶

Chris Moffitt
Instructor
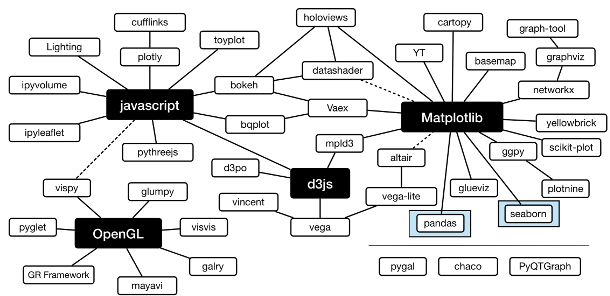
Python 可视化生态
- Python 可视化生态复杂,容易让人不知所措
Matplotlib
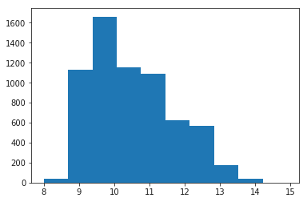
matplotlib为 Seaborn 提供底层构件- 也可单独用于绘图
import matplotlib.pyplot as plt import pandas as pddf = pd.read_csv("wines.csv")fig, ax = plt.subplots() ax.hist(df['alcohol'])
Pandas
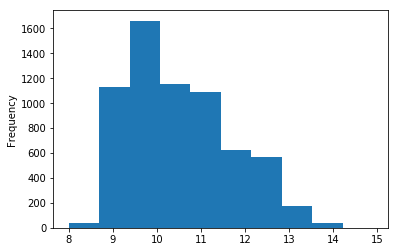
pandas是数据分析的基础库- 也支持基础绘图
import pandas as pddf = pd.read_csv("wines.csv") df['alcohol'].plot.hist()
Seaborn histplot
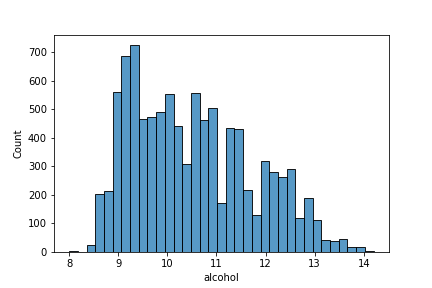
histplot类似前面示例中的直方图- 默认生成直方图,也可绘制更复杂的图
import seaborn as snssns.histplot(df['alcohol'])
Seaborn displot
displot基于histplot等函数绘制分布图- 默认生成直方图,也可生成其他类型图
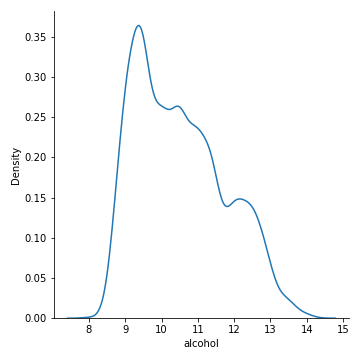
import seaborn as snssns.displot(df['alcohol'], kind='kde')
pandas 直方图 vs. Displot
- Pandas 直方图
df['alcohol'].plot.hist()- 观测频数为准
- 无柱形边框
- 组距较宽
- 无 x 轴标签
- Seaborn displot
sns.displot(df['alcohol'])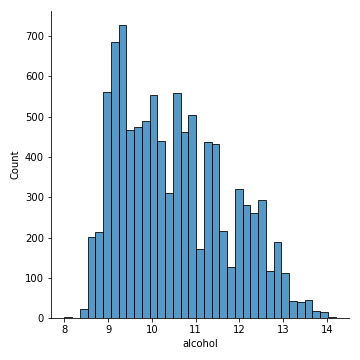
- 自动 x 轴标签
- 柔和配色
- 更简洁

