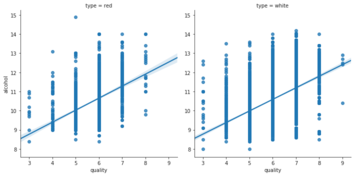
Seaborn 中的回归图
Seaborn 数据可视化进阶

Chris Moffitt
Instructor
regplot 简介
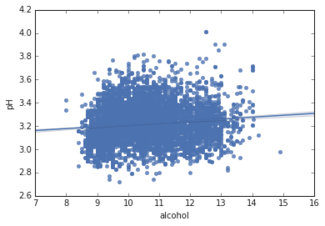
regplot会生成带回归线的散点图- 用法与
displot类似 - 必须指定
data、x和y
sns.regplot(data=df, x="alcohol", y="pH" )
lmplot() 基于 regplot() 构建
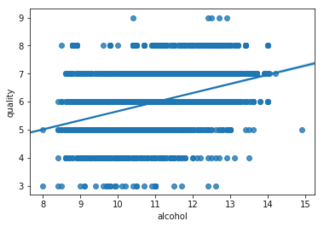
regplot—— 低层接口
sns.regplot(data=df,
            x="alcohol",
            y="quality")
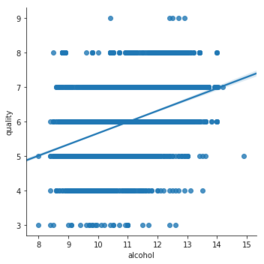
lmplot—— 高层接口
sns.lmplot(data=df,
           x="alcohol",
           y="quality")
lmplot 分面
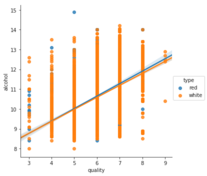
- 按颜色组织数据(
hue)
sns.lmplot(data=df,
           x="quality",
           y="alcohol",
           hue="type")
- 按列分面(
col)
sns.lmplot(data=df,
           x="quality",
           y="alcohol",
           col="type")