Python 中的广义线性模型
Ita Cirovic Donev
Data Science Consultant
import seaborn as sns
import matplotlib.pyplot as plt
'sat ~ width'
model
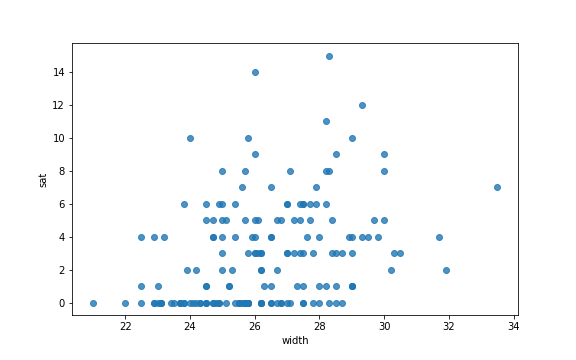
# Adjust figure size
plt.subplots(figsize = (8, 5))
# Plot data points
sns.regplot('width', 'sat',
            data = crab,
            fit_reg = False)
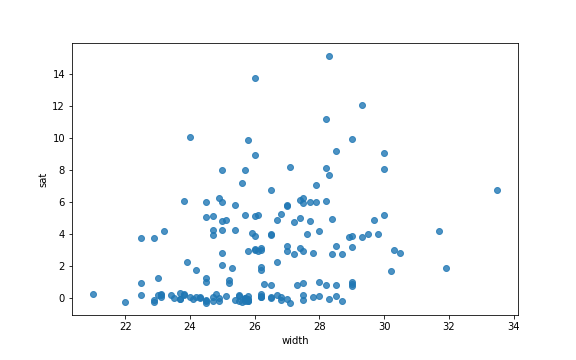
sns.regplot('width', 'sat',
            data = crab,
            fit_reg = False,
            y_jitter = 0.3)
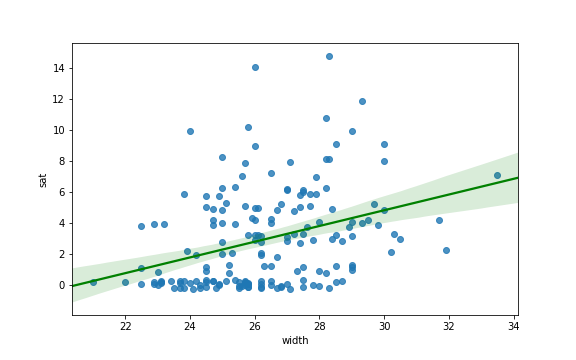
sns.regplot('width', 'sat',
            data = crab,
            y_jitter = 0.3,
            fit_reg = True,
            line_kws = {'color':'green',
                        'label':'LM fit'})
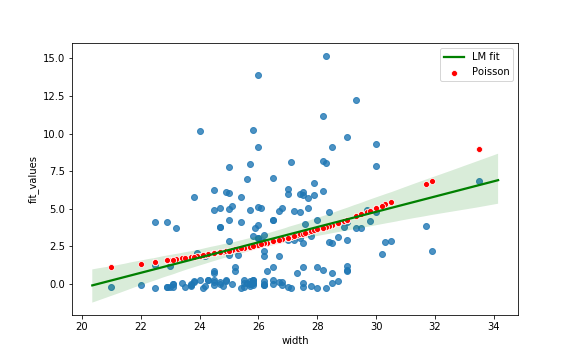
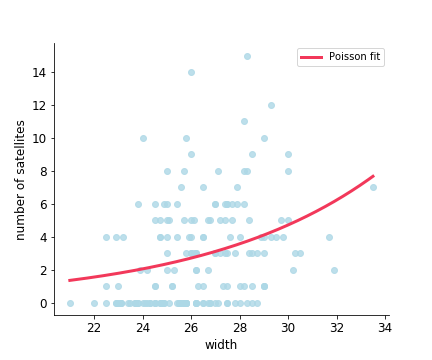
crab['fit_values'] = model.fittedvalues
sns.scatterplot('width','fit_values',
                data = crab,
                color = 'red',
                label = 'Poisson')
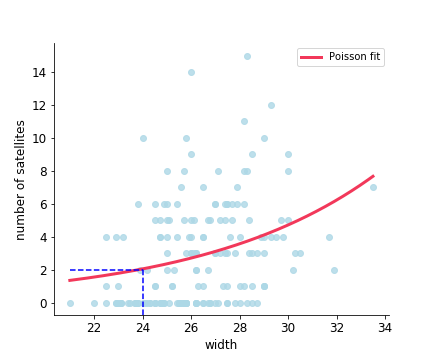
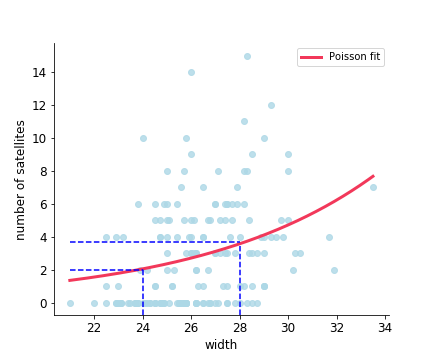
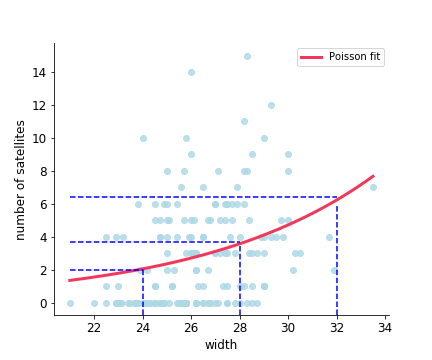
new_data = pd.DataFrame({'width':[24, 28, 32]})
model.predict(new_data)
0 1.881981
0    1.881981
1    3.627360
0    1.881981
1    3.627360
2    6.991433