Python 中的客户细分
Karolis Urbonas
Head of Data Science, Amazon
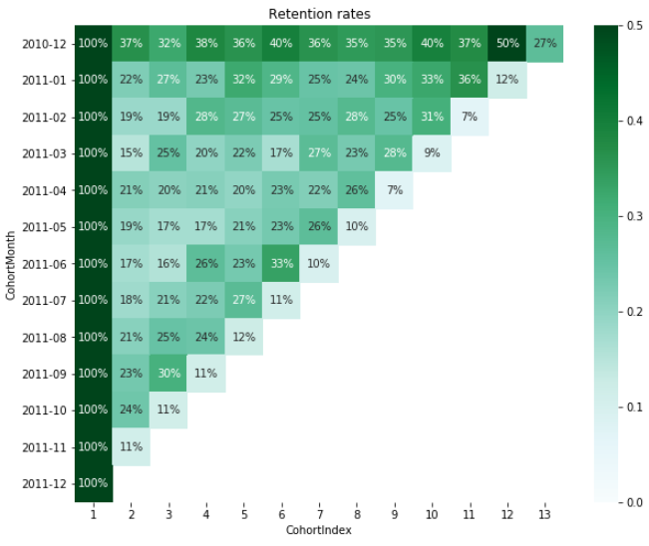
可视化分群分析的最简方式
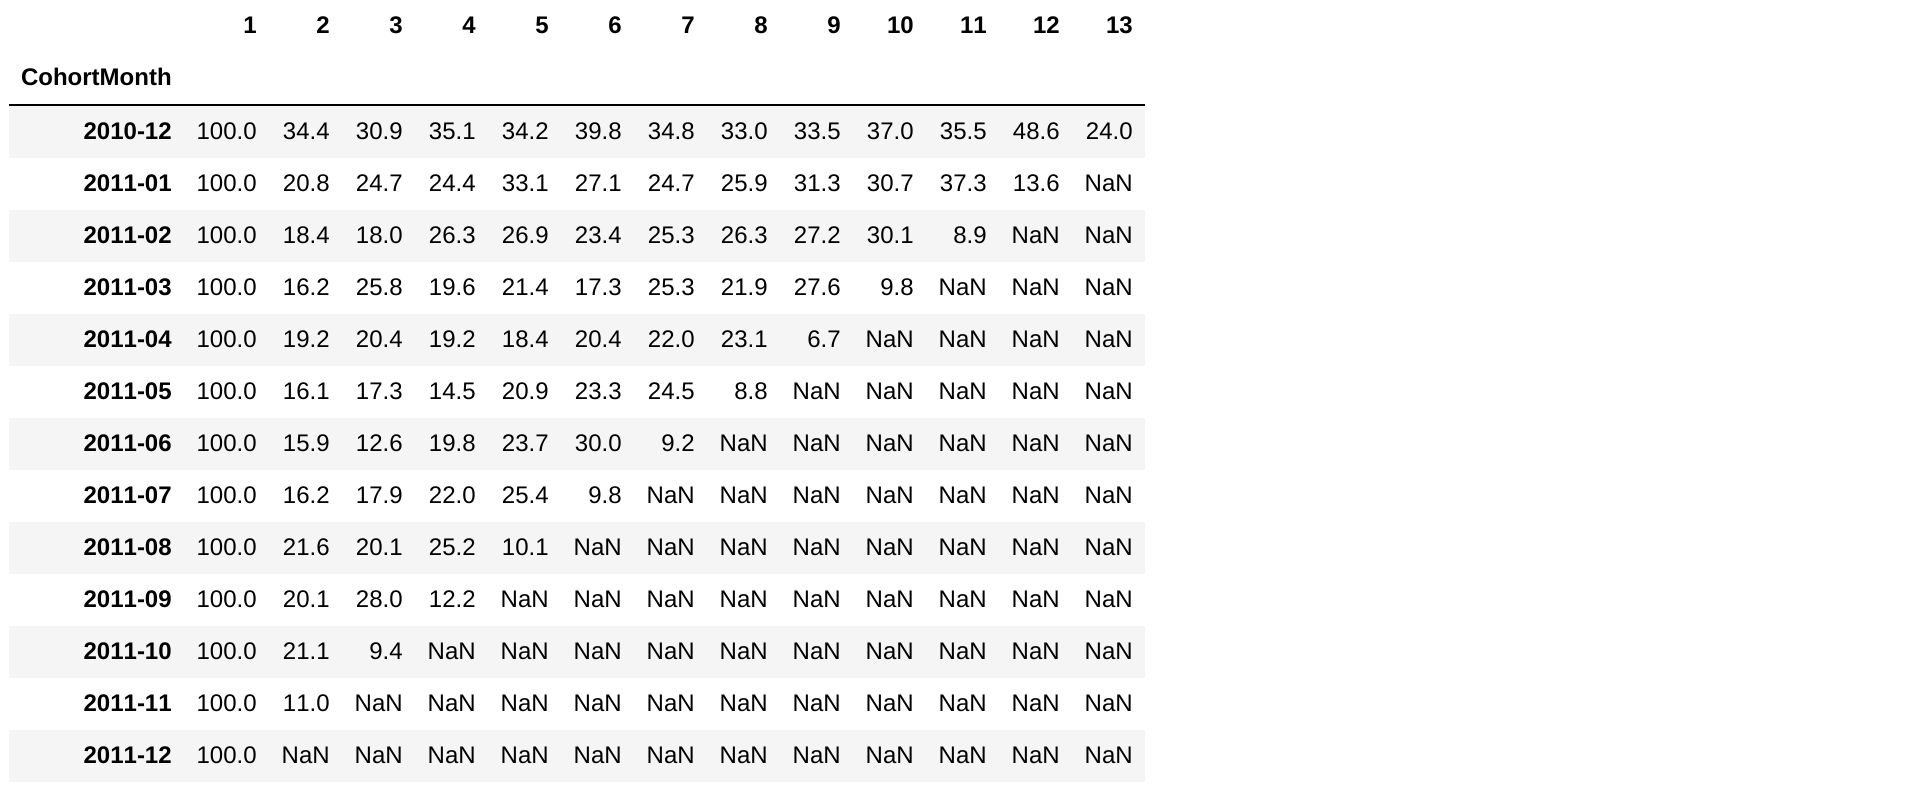
同含数据与图形
用 seaborn 只需几行代码
seaborn
retention.round(3)*100
import seaborn as sns
import matplotlib.pyplot as plt

plt.figure(figsize=(10, 8))

plt.title('Retention rates')

sns.heatmap(data = retention,
            annot = True,
            fmt = '.0%',
            vmin = 0.0,
            vmax = 0.5,
            cmap = 'BuGn')

plt.show()
import seaborn as sns import matplotlib.pyplot as plt
plt.figure(figsize=(10, 8))
plt.title('Retention rates')
sns.heatmap(data = retention, annot = True, fmt = '.0%', vmin = 0.0, vmax = 0.5, cmap = 'BuGn')
plt.show()