在 Python 中导入与管理金融数据
Stefan Jansen
Instructor
pandas
MultiIndex
nasdaq = pd.read_excel('listings.xlsx', sheet_name='nasdaq', na_values='n/a')

nasdaq.set_index('Stock Symbol', inplace=True)

top_5 = nasdaq['Market Capitalization'].nlargest(n=5) # 前5
top_5.div(1000000) # 市值(百万美元)
nasdaq = pd.read_excel('listings.xlsx', sheet_name='nasdaq', na_values='n/a')
nasdaq.set_index('Stock Symbol', inplace=True)
top_5 = nasdaq['Market Capitalization'].nlargest(n=5) # 前5 top_5.div(1000000) # 市值(百万美元)
AAPL     740024.467000
GOOG     569426.124504
...      ...
Name: Market Capitalization, dtype: float64
tickers = top_5.index.tolist() # 将索引转为列表
['AAPL', 'GOOG', 'MSFT', 'AMZN', 'FB']
df = DataReader(tickers, 'yahoo', start=date(2020, 1, 1))
<class 'pandas.core.frame.DataFrame'>
DatetimeIndex: 712 entries, 2020-01-02 to 2022-10-27
Data columns (total 30 columns):
 #   Column             Non-Null Count  Dtype
 --  ------             --------------  -----
 0   (Adj Close, AAPL)  712 non-null    float64
 1   (Adj Close, GOOG)  712 non-null    float64
 2   (Adj Close, MSFT)  712 non-null    float64
...
 28  (Volume, AMZN)     712 non-null    float64
 29  (Volume, FB)       253 non-null    float64
dtypes: float64(30)
memory usage: 172.4 KB
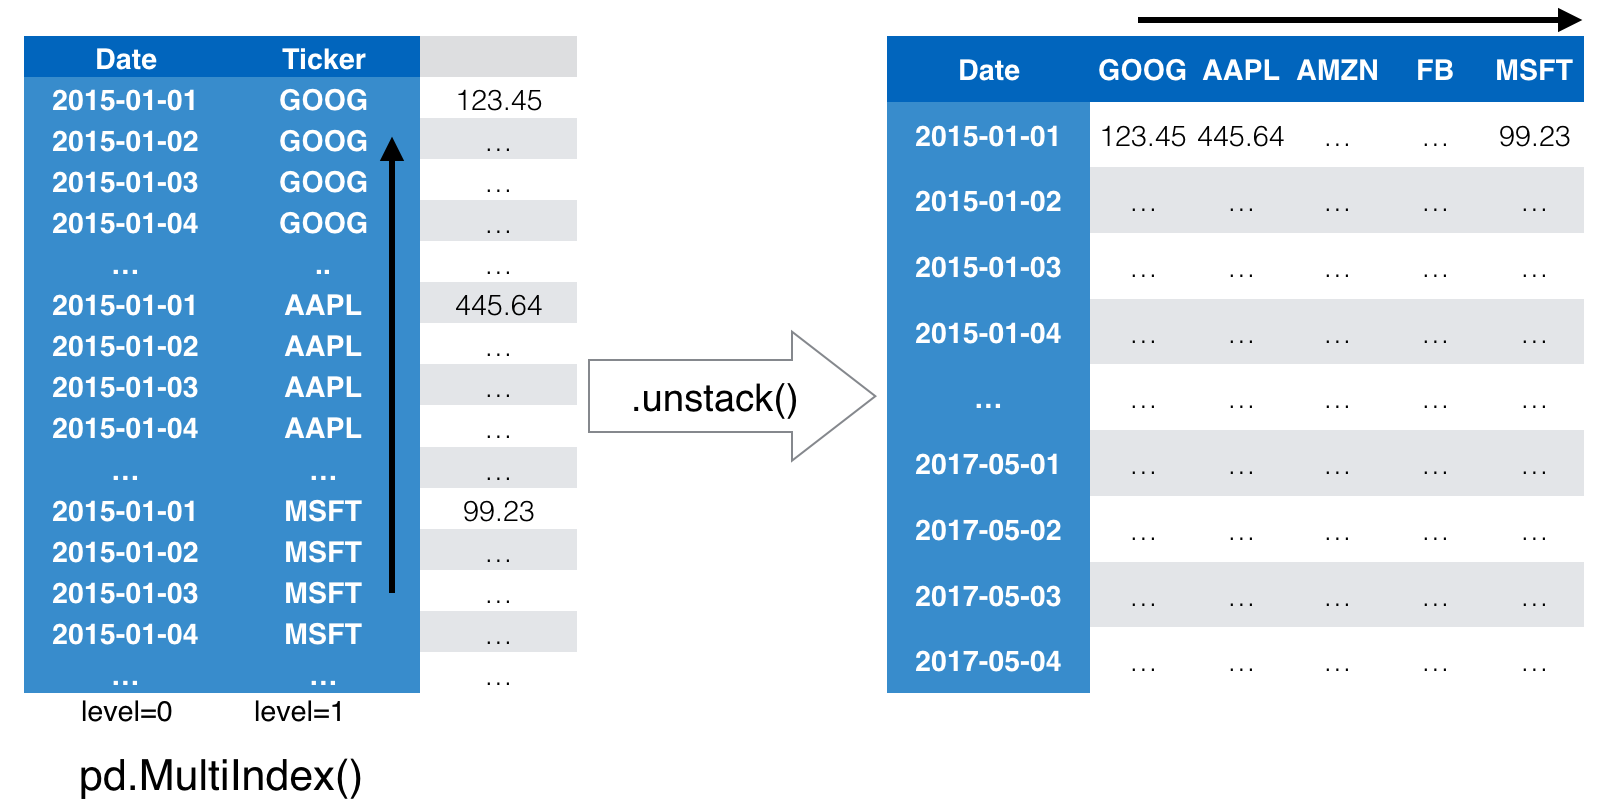
df = df.stack()
df.info()
MultiIndex: 3101 entries, (Timestamp('2020-01-02 00:00:00'), 'AAPL') to (Timestamp('2022-10-27 00:00:00'), 'FB')
Data columns (total 6 columns):
 #   Column     Non-Null Count  Dtype
 --  ------     --------------  -----
 0   Adj Close  3101 non-null   float64
...
unstacked = df['Close'].unstack()
unstacked.info()
DatetimeIndex: 712 entries, 2020-01-02 to 2022-10-27
Data columns (total 5 columns):
 #   Column  Non-Null Count  Dtype
 --  ------  --------------  -----
 0   AAPL    712 non-null    float64
 1   GOOG    712 non-null    float64
 2   MSFT    712 non-null    float64
 3   AMZN    712 non-null    float64
 4   FB      253 non-null    float64
dtypes: float64(5)
memory usage: 33.4 KB
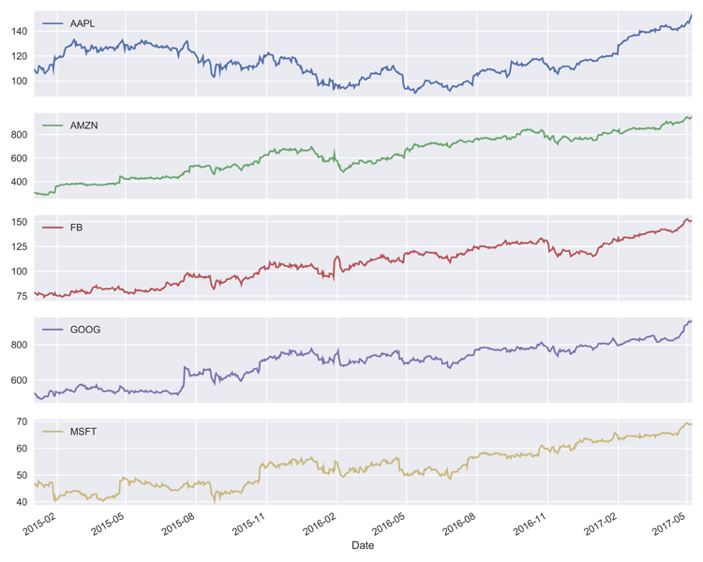
unstacked = df['Close'].unstack() # 结果为 DataFrame
unstacked.plot(subplots=True)
plt.tight_layout(); plt.show()