wb <- survreg(Surv(time, cens) ~ 1)
生存曲线:
surv <- seq(.99, .01, by = -.01)
t <- predict(wb, type = "quantile", p = 1 - surv, newdata = data.frame(1))

surv_wb <- data.frame(time = t, surv = surv,
                      upper = NA, lower = NA, std.err = NA)
绘图:
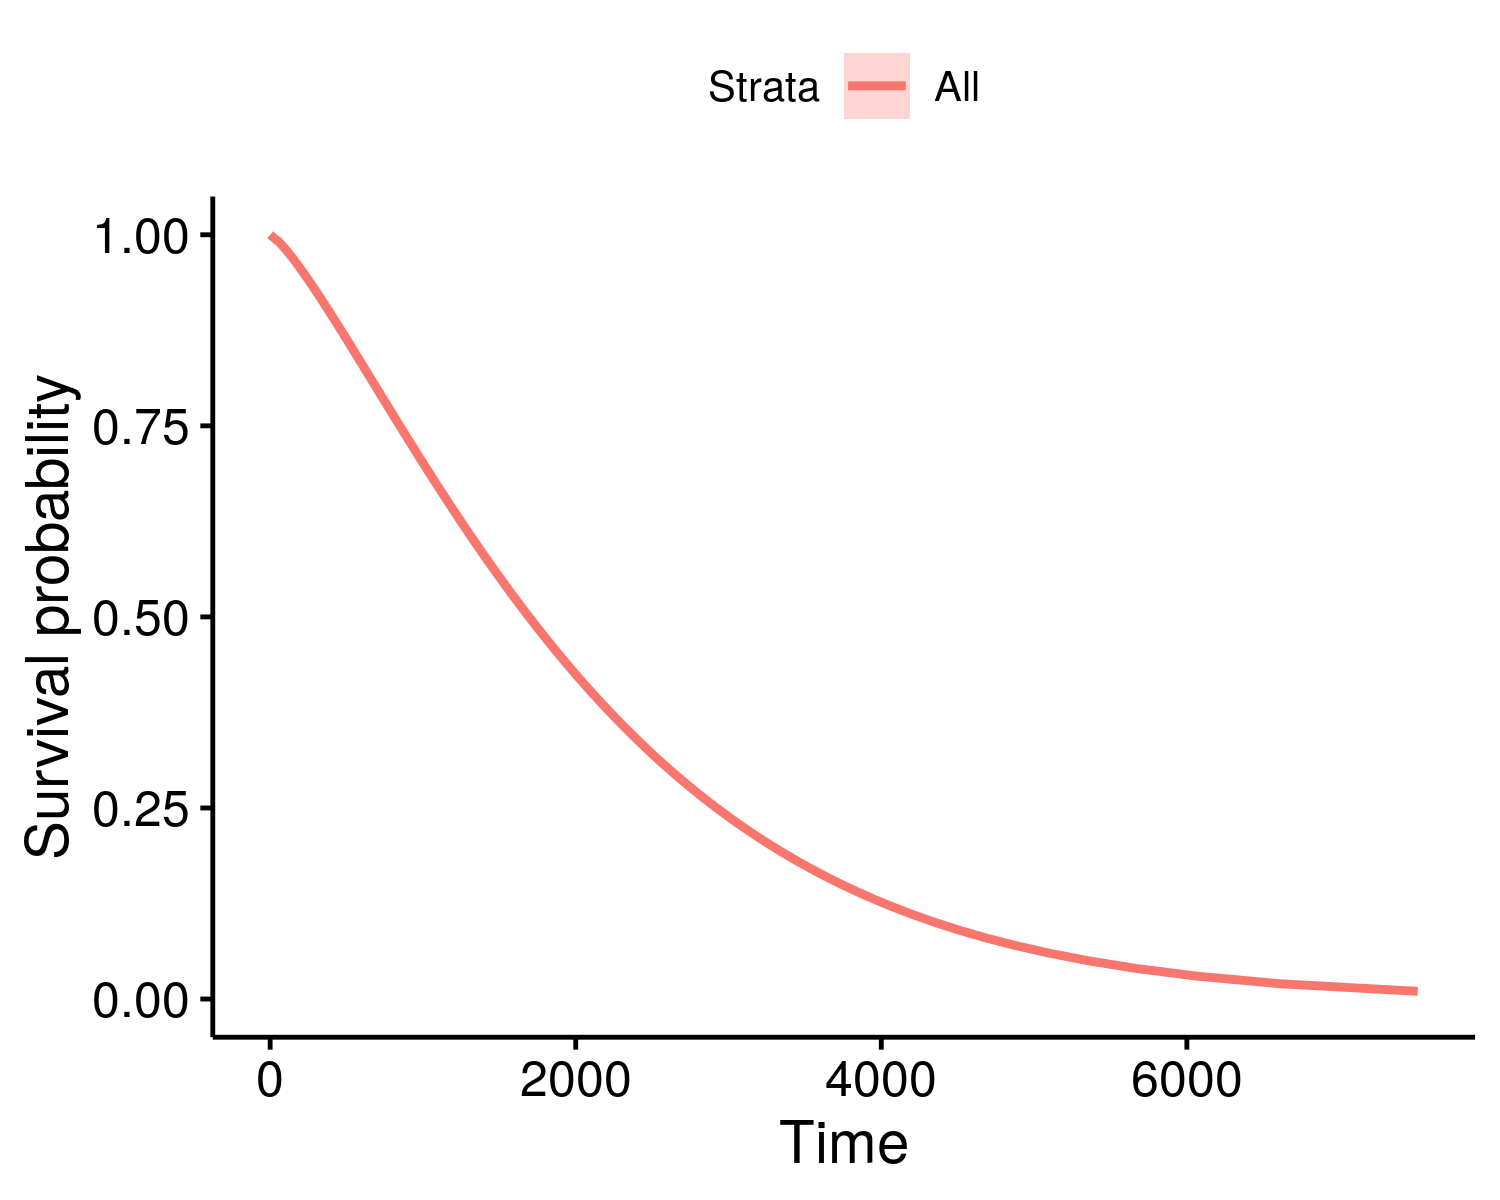
ggsurvplot_df(fit = surv_wb, surv.geom = geom_line)