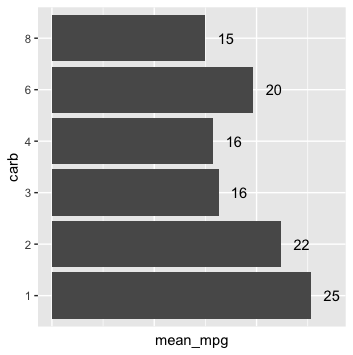
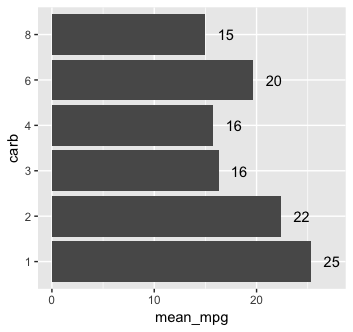
复现该图
Tidyverse 中的分类数据

Emily Robinson
Data Scientist
Labs
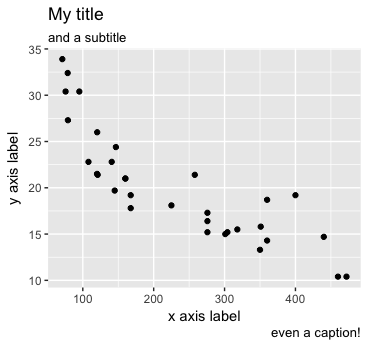
ggplot(mtcars, aes(disp, mpg)) + geom_point() +
  labs(x = "x axis label", y = "y axis label", title = "My title",
       subtitle = "and a subtitle", caption = "even a caption!")
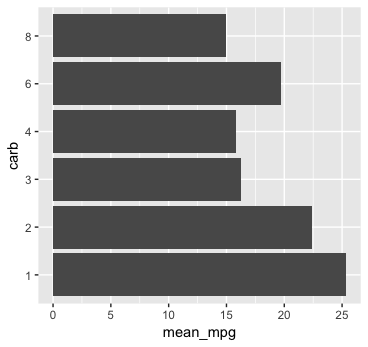
Geom_text
initial_plot + geom_text(aes(label = round(mean_mpg)))
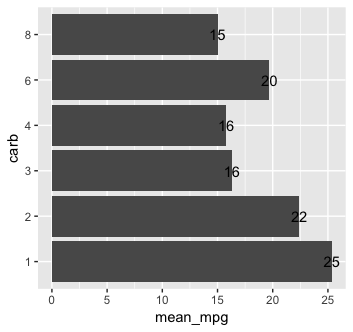
移动文本
initial_plot +
  geom_text(aes(label = round(mean_mpg), y = mean_mpg + 2))
主题
initial_plot +
  geom_text(aes(label = round(mean_mpg), y = mean_mpg + 2)) +
  theme(axis.text.x = element_blank(), axis.ticks.x = element_blank())