重新排序因子

Tidyverse 中的分类数据

Emily Robinson

Data Scientist
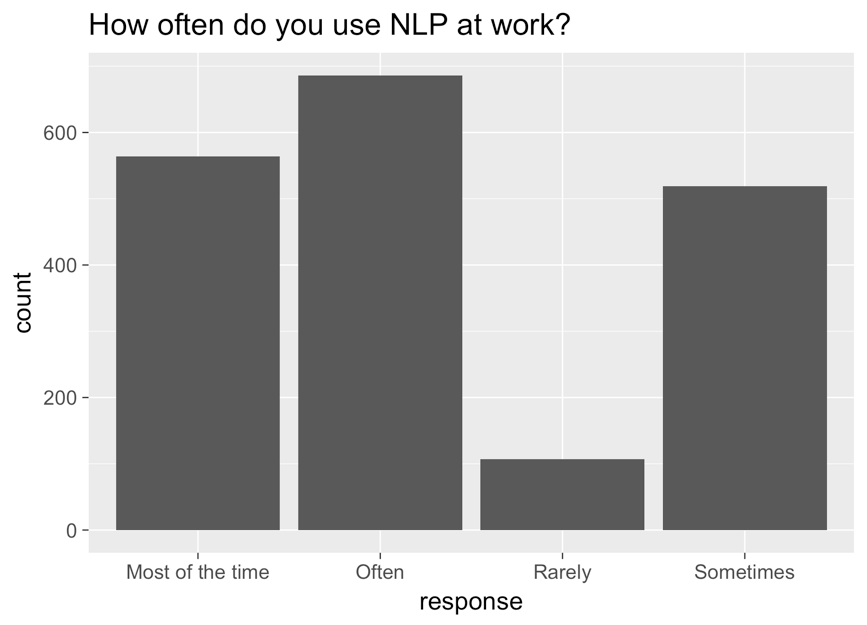
一个柱状图,x 轴为 response,y 轴为 count,标题为"你在工作中多久使用一次 NLP?" 从左到右的柱为:大多数时候、经常、很少、有时。

Tidyverse 中的分类数据

已纠正的图

ggplot(aes(nlp_frequency, 
            x = fct_relevel(response, 
            "Rarely", "Sometimes", "Often", "Most of the time"))) + 
        geom_bar()
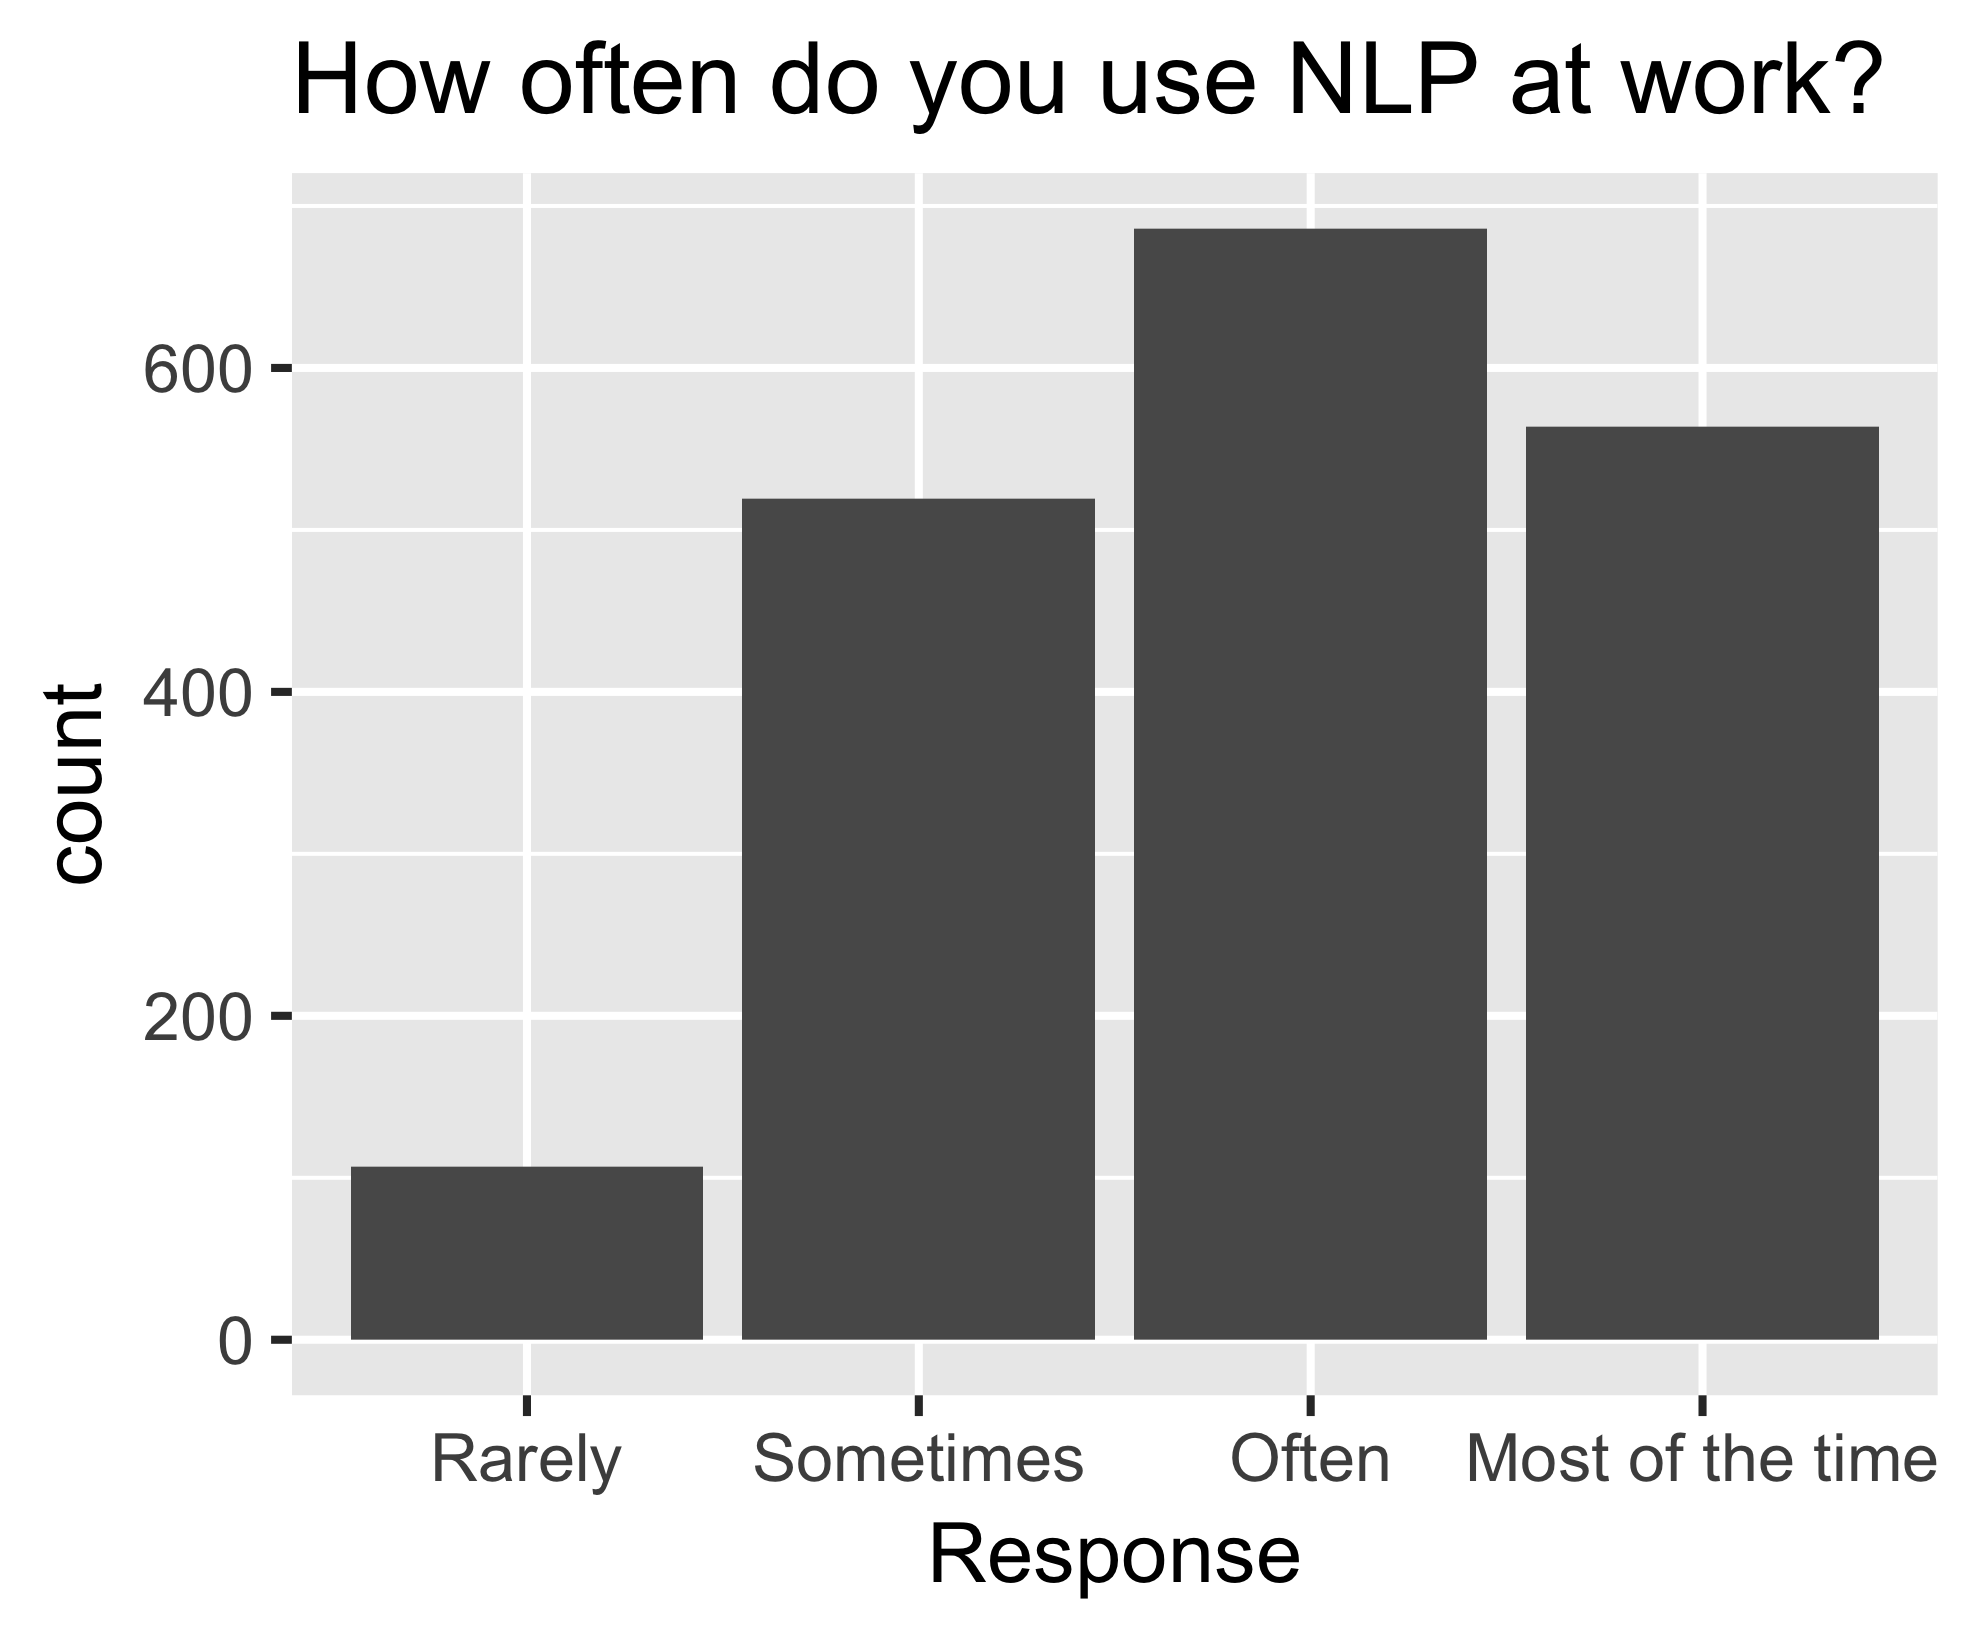
与前一图相同,但顺序已纠正:从左到右为 很少、有时、经常、大多数时候。

Tidyverse 中的分类数据

fct_reorder()

nlp_frequency %>%
    pull(response) %>%
    levels()
[1] "Most of the time" "Often" "Rarely" "Sometimes"       
nlp_frequency %>%
    mutate(response = fct_relevel(response, 
            "Often", "Most of the time")) %>%
    pull(response) %>%
    levels()
[1] "Often" "Most of the time" "Rarely" "Sometimes"
Tidyverse 中的分类数据

其他参数

nlp_frequency %>%
    mutate(response = fct_relevel(response, 
            "Often", "Most of the time", after = 2)) %>%
            pull(response) %>%
            levels()
nlp_frequency %>%
    mutate(response = fct_relevel(response, 
            "Often", "Most of the time", after = Inf) %>%
    pull(response) %>%
    levels()
[1] "Rarely" "Sometimes" "Often" "Most of the time"
Tidyverse 中的分类数据

让我们练习!

Tidyverse 中的分类数据

Preparing Video For Download...