Matplotlib
面向 R 用户的 Python

Daniel Chen
Instructor
Matplotlib 绘图
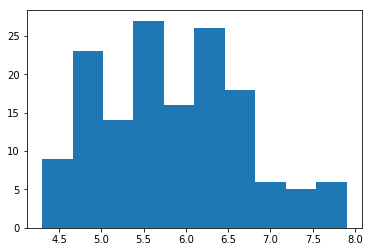
import matplotlib.pyplot as plt
plt.hist(iris['sepal_length'])
plt.show()
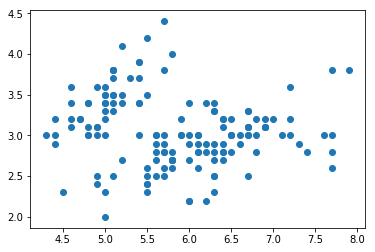
Matplotlib 散点图
plt.scatter(iris['sepal_length'], iris['sepal_width'])
plt.show()
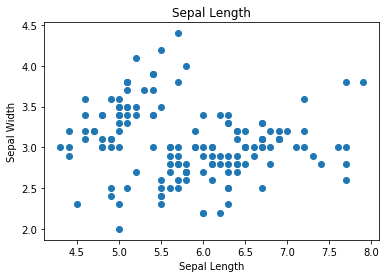
美化图形
fig, ax = plt.subplots()
ax.scatter(iris['sepal_length'], iris['sepal_width'])
ax.set_title('Sepal Length')
ax.set_xlabel('Sepal Length')
ax.set_ylabel('Sepal Width')
plt.show()
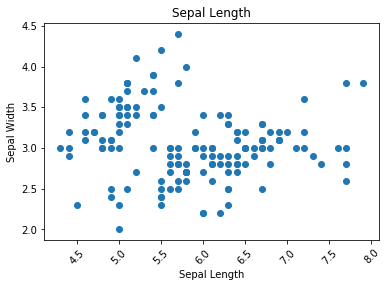
旋转坐标轴刻度
fig, ax = plt.subplots()
ax.scatter(iris['sepal_length'], iris['sepal_width'])
ax.set_title('Sepal Length')
ax.set_xlabel('Sepal Length')
ax.set_ylabel('Sepal Width')
plt.xticks(rotation=45) # rotate the x-axis ticks
plt.show()
Matplotlib 图形的组成
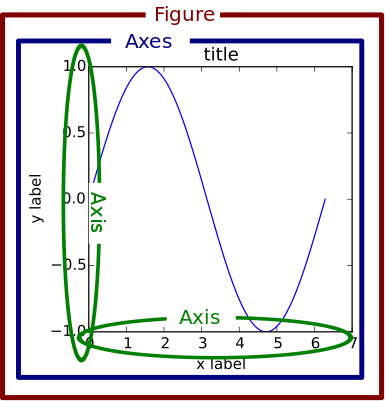
Matplotlib 图形的组成 2
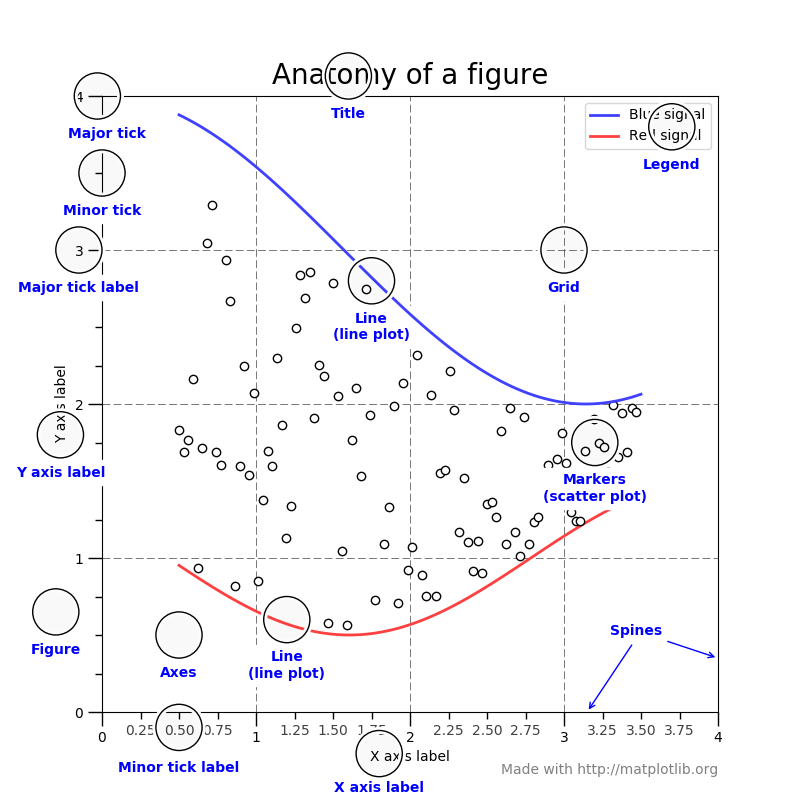
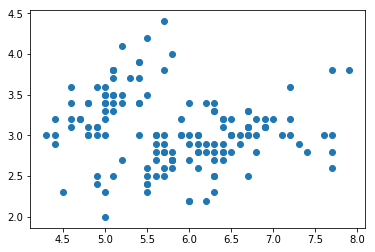
Figure 与 Axes
fig, ax = plt.subplots()
ax.scatter(iris['sepal_length'], iris['sepal_width'])
plt.show()
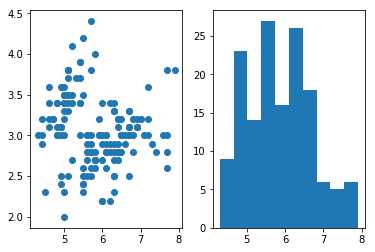
多个 Axes
fig, (ax1, ax2) = plt.subplots(1, 2)
ax1.scatter(iris['sepal_length'], iris['sepal_width'])
ax2.hist(iris['sepal_length'])
plt.show()
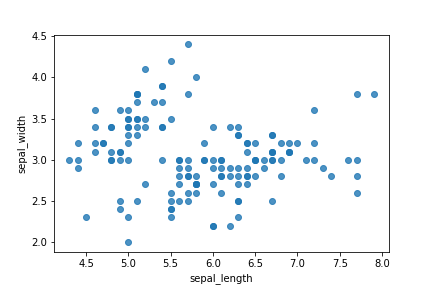
请记住
fig, ax = plt.subplots()
sns.regplot(x='sepal_length', y='sepal_width',
            data=iris, fit_reg=False, ax=ax)
plt.show()
清空图形
fig, (ax1, ax2) = plt.subplots(1, 2)
ax1.scatter(iris['sepal_length'], iris['sepal_width'])
ax2.hist(iris['sepal_length'])
plt.show()
plt.clf()

