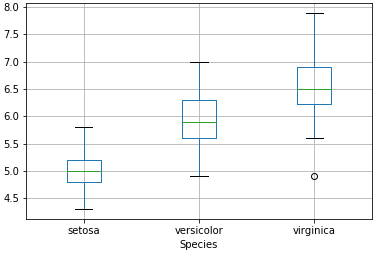
直接用 pandas 作图
面向 R 用户的 Python

Daniel Chen
Instructor
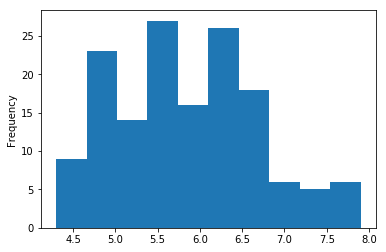
单变量:直方图
import matplotlib.pyplot as plt
iris['sepal_length'].plot(kind='hist')
plt.show()
单变量:条形图
cts = iris['species'].value_counts()
cts.plot(kind='bar')
plt.show()

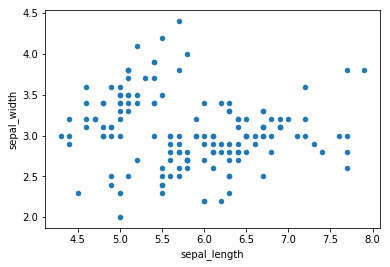
双变量:散点图
iris.plot(kind='scatter', x='Sepal.Length', y='Sepal.Width')
plt.show()
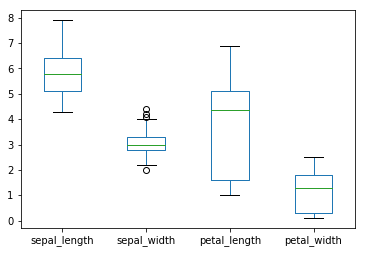
双变量:箱线图
iris.plot(kind='box')
plt.show()
双变量:箱线图
iris.boxplot(by='Species', column='Sepal.Length')
plt.show()