基于与其他特征的相关性进行选择

R 中的降维

Matt Pickard

Owner, Pickard Predictives, LLC

回顾相关图的创建

healthcare_df %>% 
  select(where(is.numeric)) %>%

correlate() %>%
shave() %>%
rplot(print_cor = TRUE) +
theme(axis.text.x = element_text(angle = 90, hjust = 1))
R 中的降维

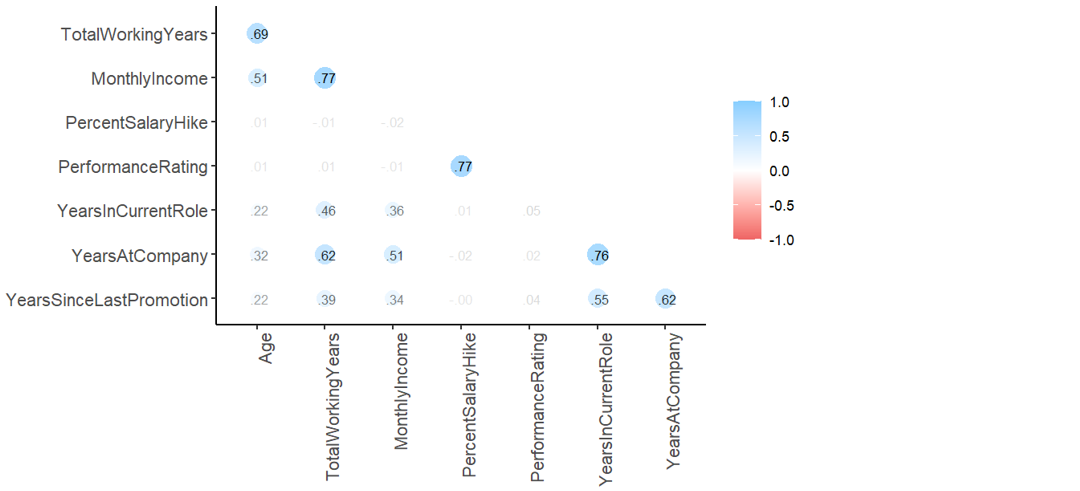
相关图

医疗公司离职率的相关图

R 中的降维

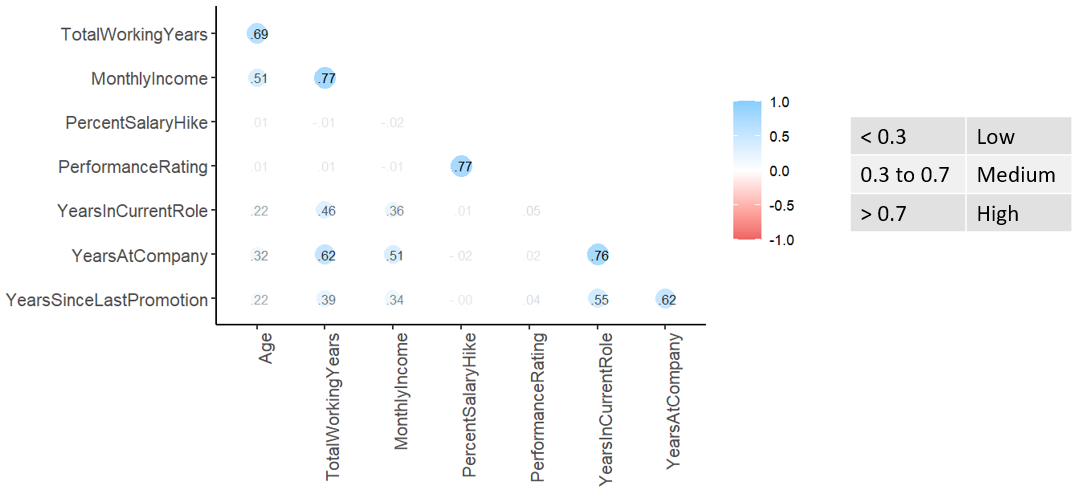
相关强度

医疗公司离职率的相关图及相关强度范围表

R 中的降维

相关性过滤器?

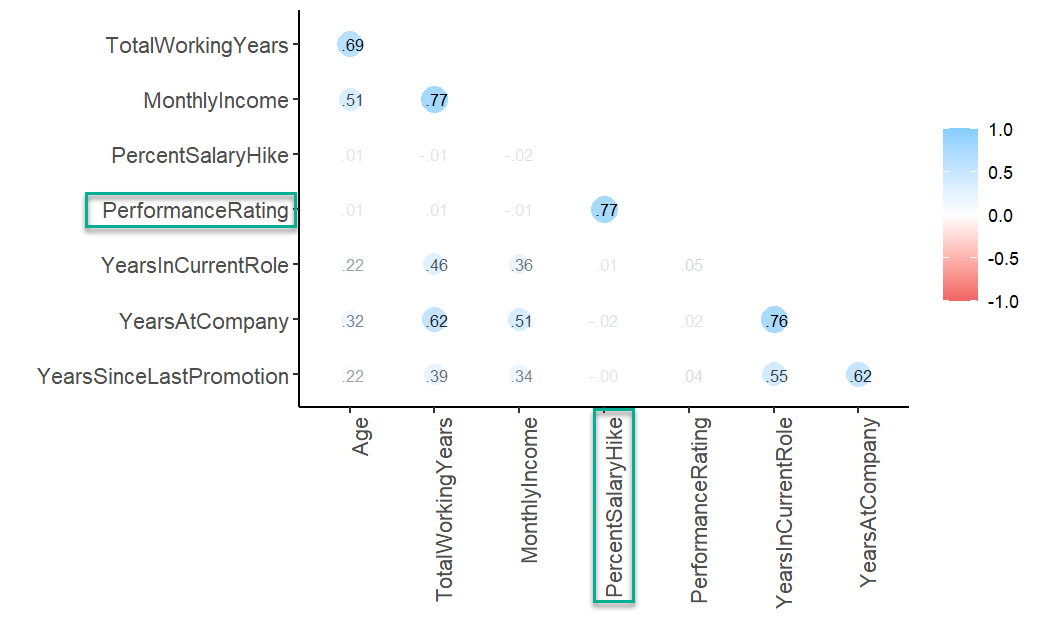
医疗公司离职率的相关图

R 中的降维

相关性过滤器?

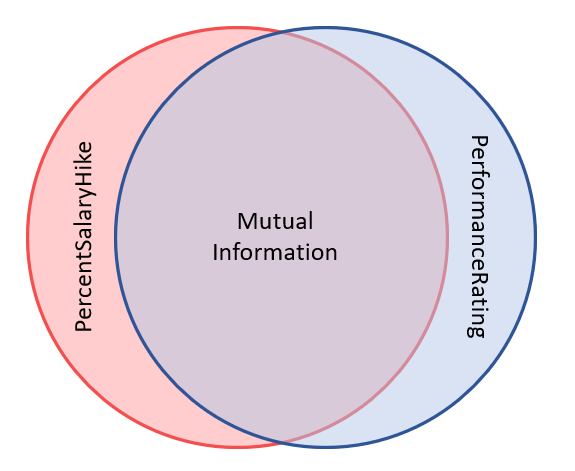
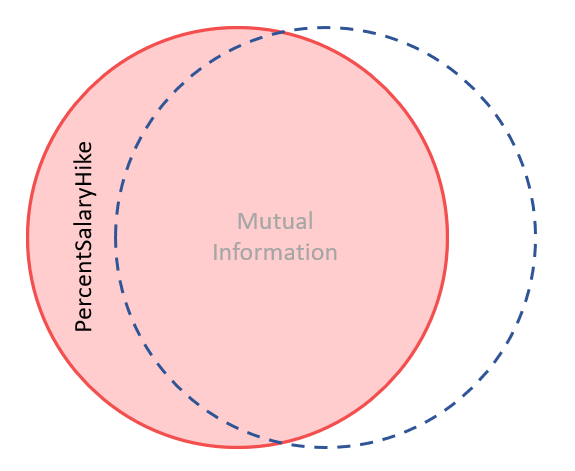
加薪百分比与绩效评分的维恩图,显示大量互信息重叠

R 中的降维

相关性过滤器?

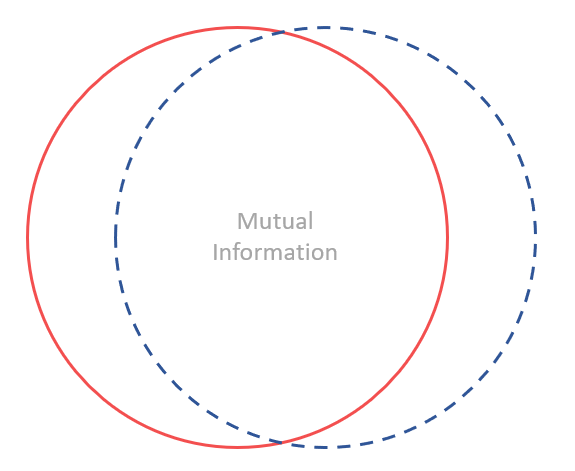
移除绩效评分后的加薪百分比维恩图

R 中的降维

相关性过滤器?

移除维恩图两部分,表示删除了有价值的信息

R 中的降维

相关性过滤配方

# create and prep the recipe
corr_recipe <-  
  recipe(Attrition ~ ., data = healthcare_df) %>%

step_corr(all_numeric_predictors(), threshold = 0.7) %>%
prep()
# Apply the recipe to the data filtered_healthcare_df <- corr_recipe %>% bake(new_data = NULL)
# Identify the features that were removed tidy(corr_recipe, number = 1)
R 中的降维

开始练习!

R 中的降维

Preparing Video For Download...