基于方差的选择

R 中的降维

Matt Pickard

Owner, Pickard Predictives, LLC

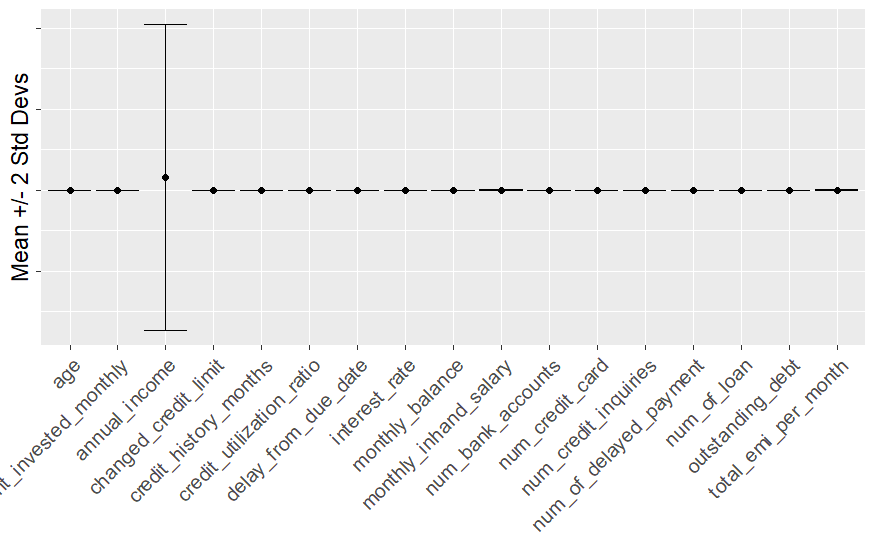
未缩放数据的方差

未标准化信用数据的均值图(含标准差误差线)

R 中的降维

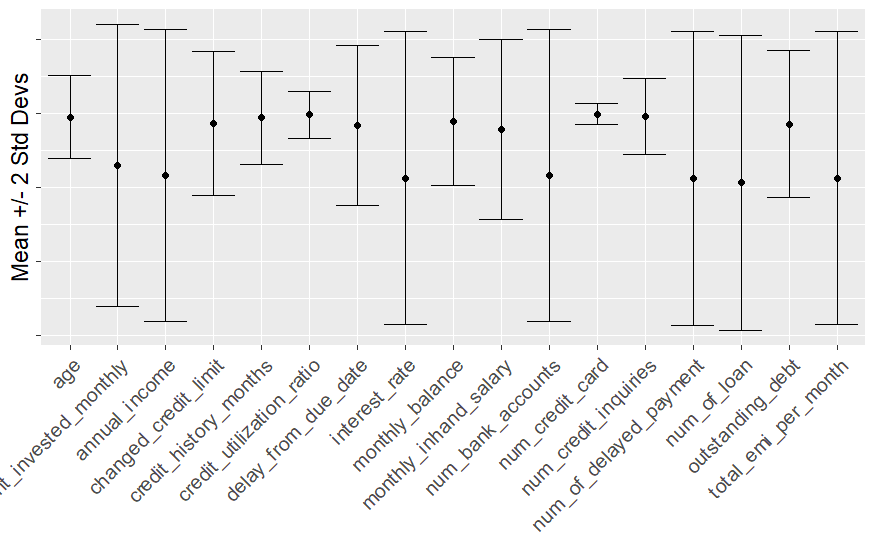
缩放后数据的方差

标准化信用数据的均值图(含标准差误差线)

R 中的降维

计算缩放后的方差

credit_variances <- credit_df %>% 
  summarize(across(everything(), ~ var(scale(., center = FALSE)), na.rm = TRUE)) %>%

pivot_longer(everything(), names_to = "feature", values_to = "variance") %>%
arrange(desc(variance)) credit_variances
# A tibble: 17 × 2
   feature                  variance
   <chr>                       <dbl>
 1 num_of_loan               0.996  
 2 num_of_delayed_payment    0.986   
 ...
R 中的降维

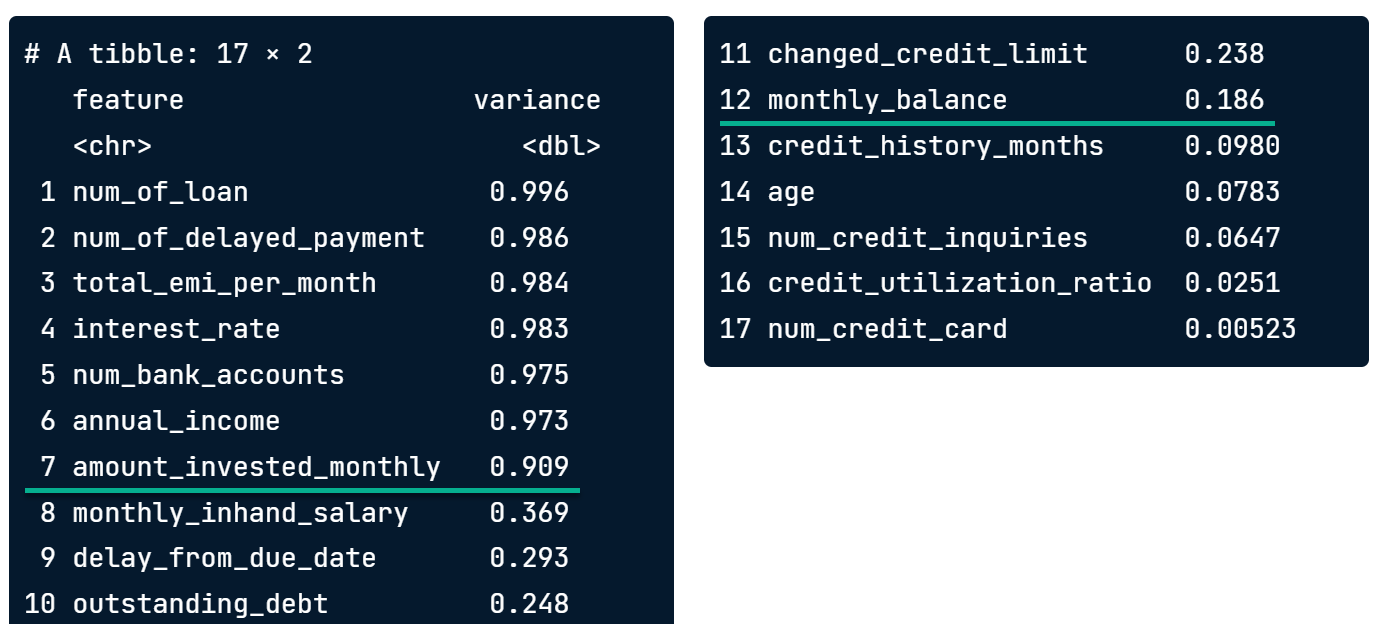
方差阈值

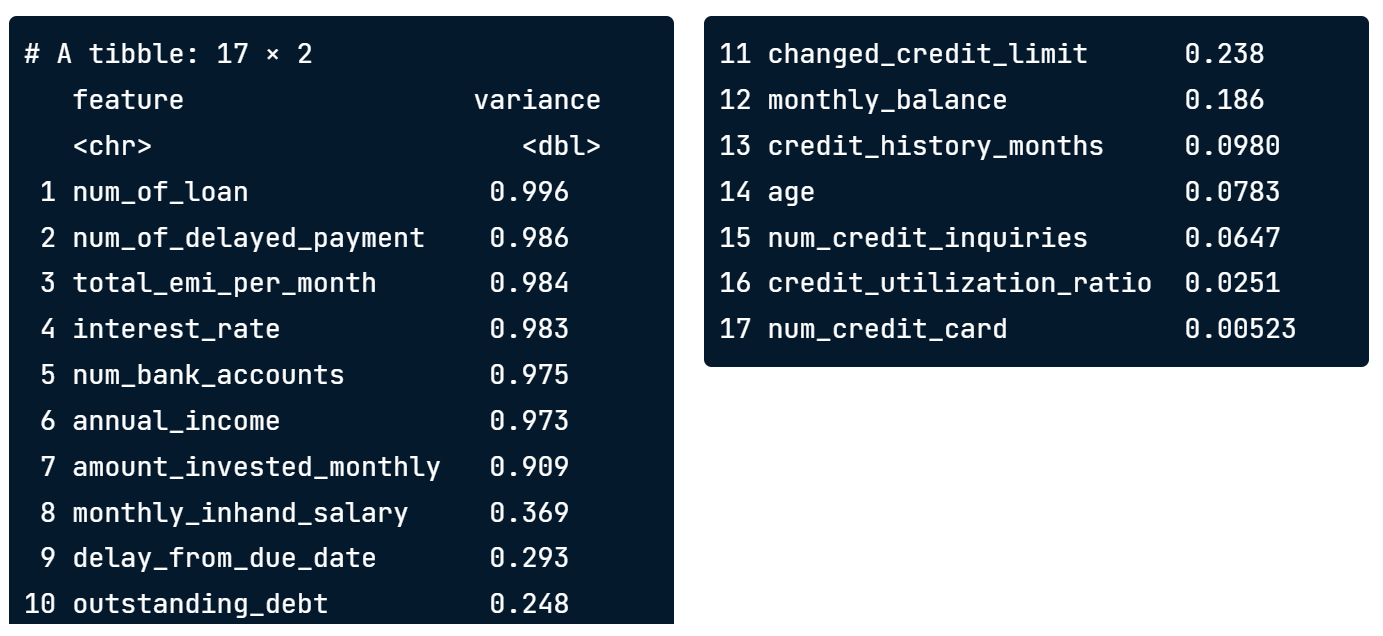
方差输出

R 中的降维

方差阈值

显示首个可能截断的方差输出

R 中的降维

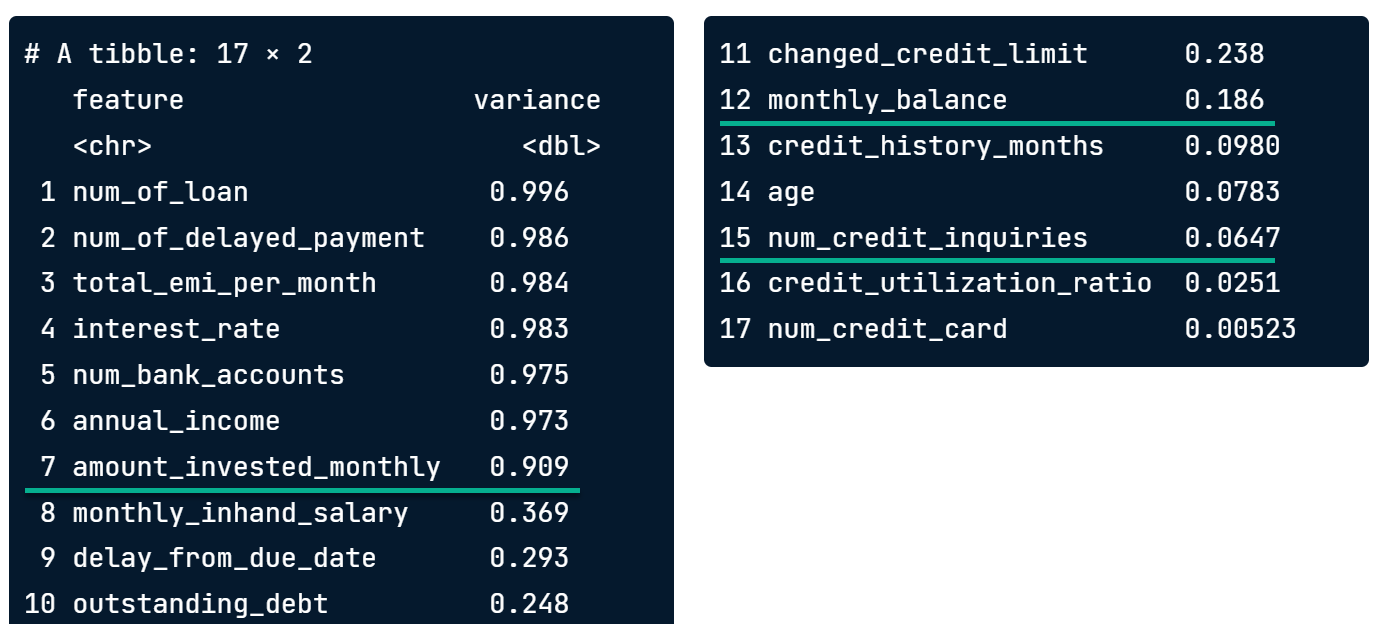
方差阈值

显示首个可能截断的方差输出

R 中的降维

方差阈值

显示首个可能截断的方差输出

R 中的降维

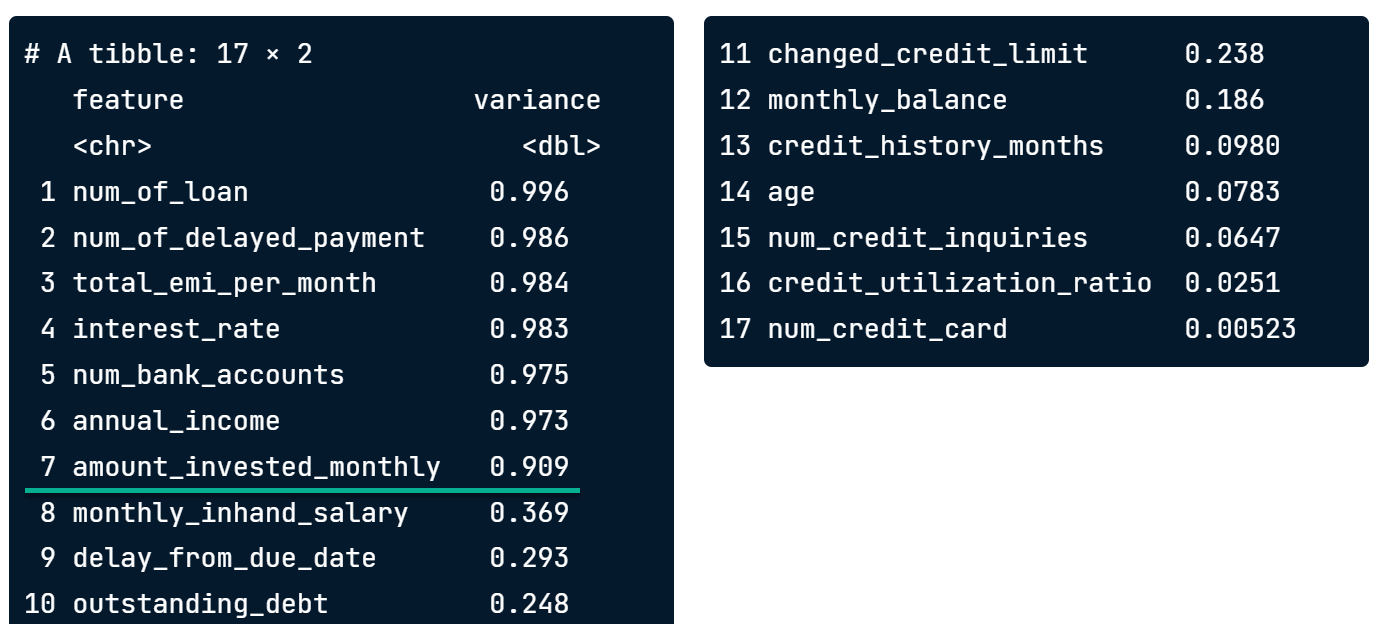
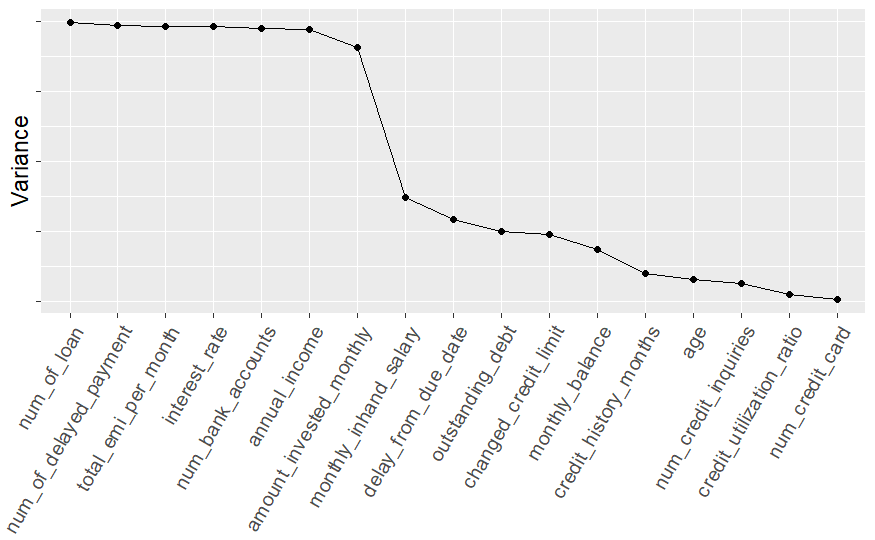
方差阈值图

方差阈值图

R 中的降维

创建方差过滤器

low_var_filter <- credit_variances %>% 
  filter(variance < 0.1) %>% 
  pull(feature)

low_var_filter
[1] "credit_history_months"    "age"                     
[3] "num_credit_inquiries"     "credit_utilization_ratio"
[5] "num_credit_card"   
R 中的降维

tidymodel 方法

创建配方

low_variance_recipe <- recipe(credit_score ~ ., data = credit_df) %>%

step_zv(all_predictors()) %>%
step_scale(all_numeric_predictors()) %>%
step_nzv(all_predictors()) %>%
prep()

应用配方

filtered_credit_df <- bake(low_variance_recipe, new_data = NULL)
R 中的降维

查看特定步骤的效果

low_variance_recipe <- recipe(credit_score ~ ., data = credit_df) %>% 
  step_zv(all_predictors()) %>% 
  step_scale(all_numeric_predictors()) %>% 
  step_nzv(all_predictors()) %>% 
  prep() 

tidy(low_variance_recipe, number = 3)
  terms                id       
  <chr>                <chr>    
1 num_credit_card      nzv_ni8L7
2 num_credit_inquiries nzv_ni8L7
R 中的降维

Vamos praticar!

R 中的降维

Preparing Video For Download...