Python 中的离散事件模拟
Diogo Costa (PhD, MSc)
Adjunct Professor, University of Saskatchewan, Canada & CEO of ImpactBLUE-Scientific
使用数学概念与语言描述自然或人为系统。
模型可分为:
数学模型可简可繁。
George Box:"所有模型都是错的,但有些是有用的。"

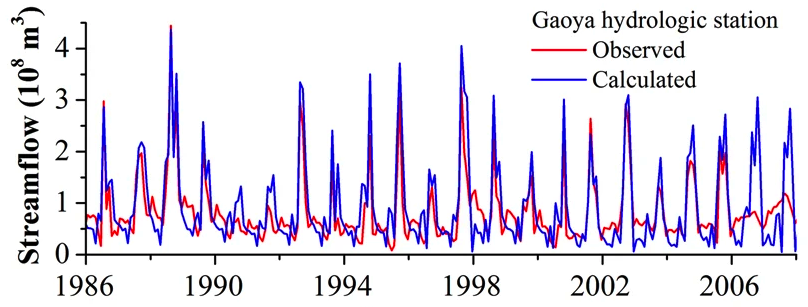
河流流量模型

该模型预测中国谷芽水文站的流量。
预测基于降雨信息,作为模型输入。
其他示例
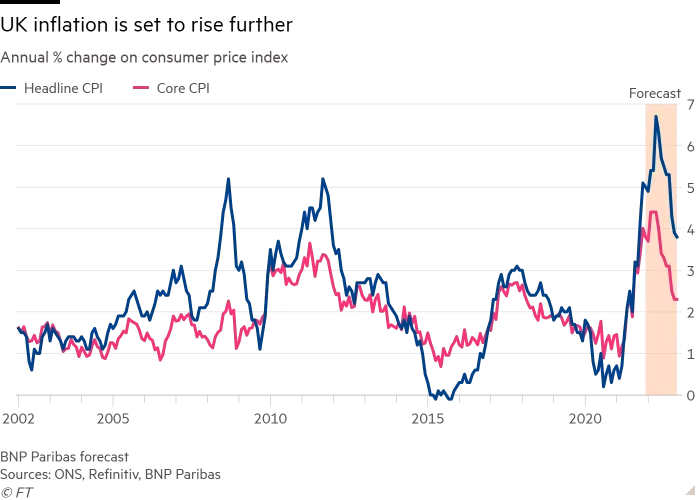
通胀预测

其他示例
# Define model parameters
processes = {"process_1": 5,
"process_2": 2,
"process_3": 3}
# Simulation period
simulation_time = 365
# Run model
discrete_model(processes, simulation_time)
def discrete_model(processes, simulation_time): # 1) Run end-condition while (time < simulation_time): process_names = list(processes.keys())# 2) Loop over all processes for p in range(len(process_names)): process_name_p = process_names[p]# 3) Account for effect of each process time += processes[process_name_p]
制造活动的离散事件模型输出示例
=> START OF SIMULATION (Time = 0 days)
Time = 6.00 days | Process Complete: Transport of raw material
Time = 9.00 days | Process Complete: Building components
Time = 11.00 days | Process Complete: Assembling parts
Time = 14.00 days | Process Complete: Selling product
=> COMPLETED: Supply-Chain cycle #1 | Time = 15.5 days
Time = 21.50 days | Process Complete: Transport raw material
Time = 24.50 days | Process Complete: Building components
Time = 26.50 days | Process Complete: Assembling parts
Time = 29.50 days | Process Complete: Selling product
=> COMPLETED: Supply-Chain cycle #2 | Time = 31.0 days
结果可视化:有助于发现模式与临界点
可视化应贴合仿真目标
常用可视化库:matplotlib、seaborn、plotly

示例
y) 与时间值 (x) 做 2D 折线/散点图plt.plot(x, y, color='green', marker='o',
markersize=12, linestyle='dashed',
linewidth=2)
x 分箱并统计每箱数量plt.hist(x, 50, density=True,
facecolor='g', alpha=0.75)
Python 中的离散事件模拟