使用 Geopandas 的基础制图

使用 Python 分析美国人口普查数据

Lee Hachadoorian

Asst. Professor of Instruction, Temple University

地理空间数据 - 进阶学习

使用 Python 分析美国人口普查数据

加载地理空间数据

import geopandas as gpd

# 读取地理空间文件 geo_state = gpd.read_file("state_computer_use.gpkg")
type(geo_state)
geopandas.geodataframe.GeoDataFrame
使用 Python 分析美国人口普查数据

Geopandas DataFrame

print(geo_state.columns)
Index(['state', 'postal', 'name', 'geometry', 'total', 'has_computer',
       'desktop_laptop', 'desktop_laptop_only', 'portable_device',
       'portable_device_only', 'no_computer'],
      dtype='object')
使用 Python 分析美国人口普查数据

Geopandas DataFrame

print(geo_state.head())
  state postal  ... portable_device_only no_computer
0    06     CA  ...              1052406     1263635
1    08     CO  ...               148749      168639
2    11     DC  ...                23554       32916
3    16     ID  ...                46565       67454
4    17     IL  ...               415840      640062

[5 rows x 11 columns]
使用 Python 分析美国人口普查数据

Geopandas 的 geometry 列

print(geo_state["geometry"].head())
0    (POLYGON ((-1716661.572795197 -1091585.2669098...
1    (POLYGON ((-787764.8711845676 -679501.90042785...
2    (POLYGON ((1950824.825659711 -402441.066172522...
3    (POLYGON ((-1357254.591159301 77405.1771214068...
4    (POLYGON ((720437.1241238854 -496471.759394428...
Name: geometry, dtype: object
使用 Python 分析美国人口普查数据

Geopandas 作图

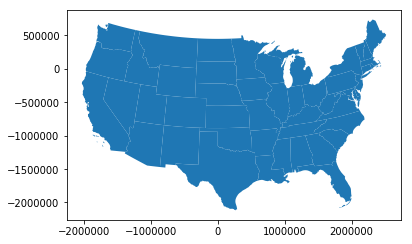
geo_state.plot()

美国本土地图。

使用 Python 分析美国人口普查数据

分级统计地图(Choropleth)

geo_state.plot(column = "has_computer")
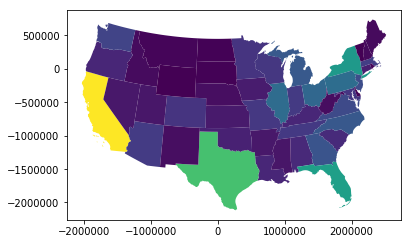
美国本土地图,各州按拥有电脑的家庭数量着色。

使用 Python 分析美国人口普查数据

分级统计地图(Choropleth)

geo_state.plot(column = "has_computer", cmap = "YlOrRd")
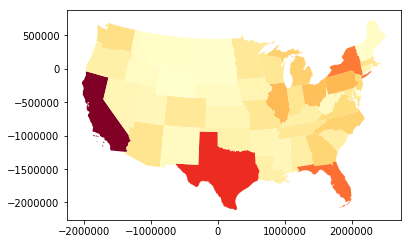
美国本土地图,各州按拥有电脑的家庭数量着色。

使用 Python 分析美国人口普查数据

分级统计地图(Choropleth)

geo_state["pct_has_computer"] = 100 * geo_state["has_computer"]/geo_state["total"]

geo_state.plot(column = "pct_has_computer", cmap = "YlOrRd")
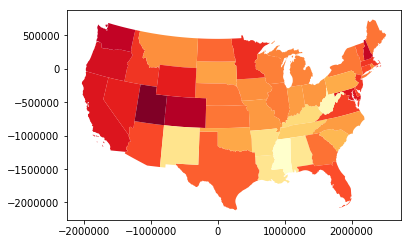
美国本土地图,各州按拥有电脑家庭的占比着色。

使用 Python 分析美国人口普查数据

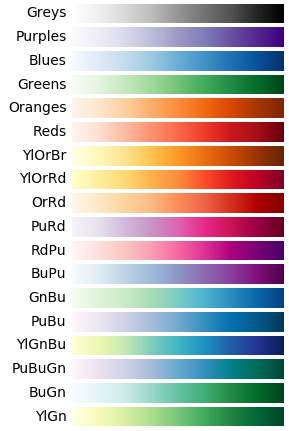
matplotlib 中 18 个从浅到深的顺序色图。

使用 Python 分析美国人口普查数据

Passons à la pratique !

使用 Python 分析美国人口普查数据

Preparing Video For Download...